Mar 15, 2017 · post
Predicting NYC Real Estate Prices with Probabilistic Programming
Probabilistic Real Estate is a prototype we built to explore the New York City real estate market. As explained in a previous post, we used probabilistic programming’s ability to incorporate hierarchical models to make predictions across neighborhoods with sparse amounts of pricing data. In this post, we’ll focus on how we designed the prototype to capitalize on another strength of probabilistic programming: the ability to generate probability distributions.
Prototype Overview: Price Mode
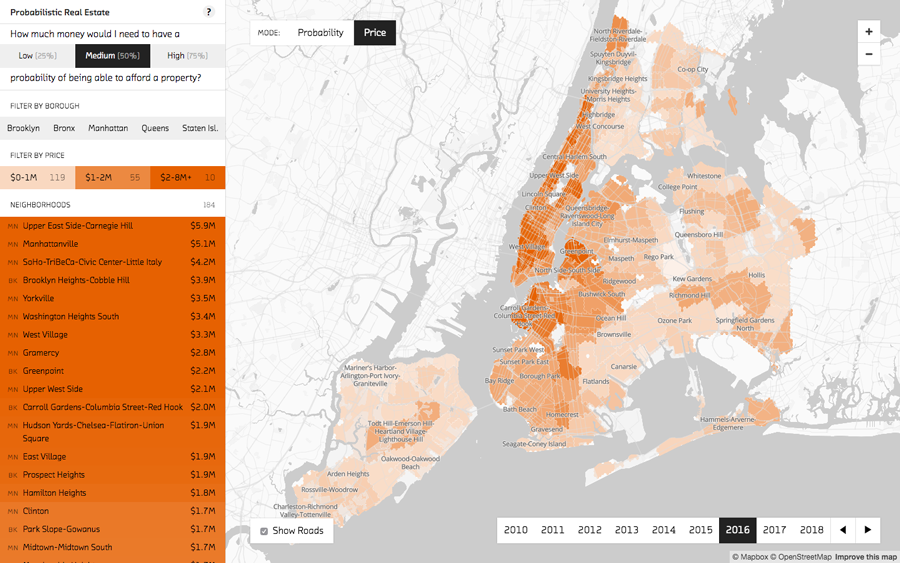
In price mode, Probabilistic Real Estate shows the median price for each neighborhood.
In price mode, the prototype’s most conventional view, the strength of the orange shading is determined by the median price for each neighborhood. This creates a heat map of relative neighborhood real estate prices. The most expensive neighborhoods are clustered in Manhattan, with nearby Brooklyn and Queens neighborhoods a close second. The map view is complemented by the sidebar, which provides a list of the neighborhoods ordered by price. Use the sidebar to quickly spot things like the most expensive neighborhood (the Upper East Side).
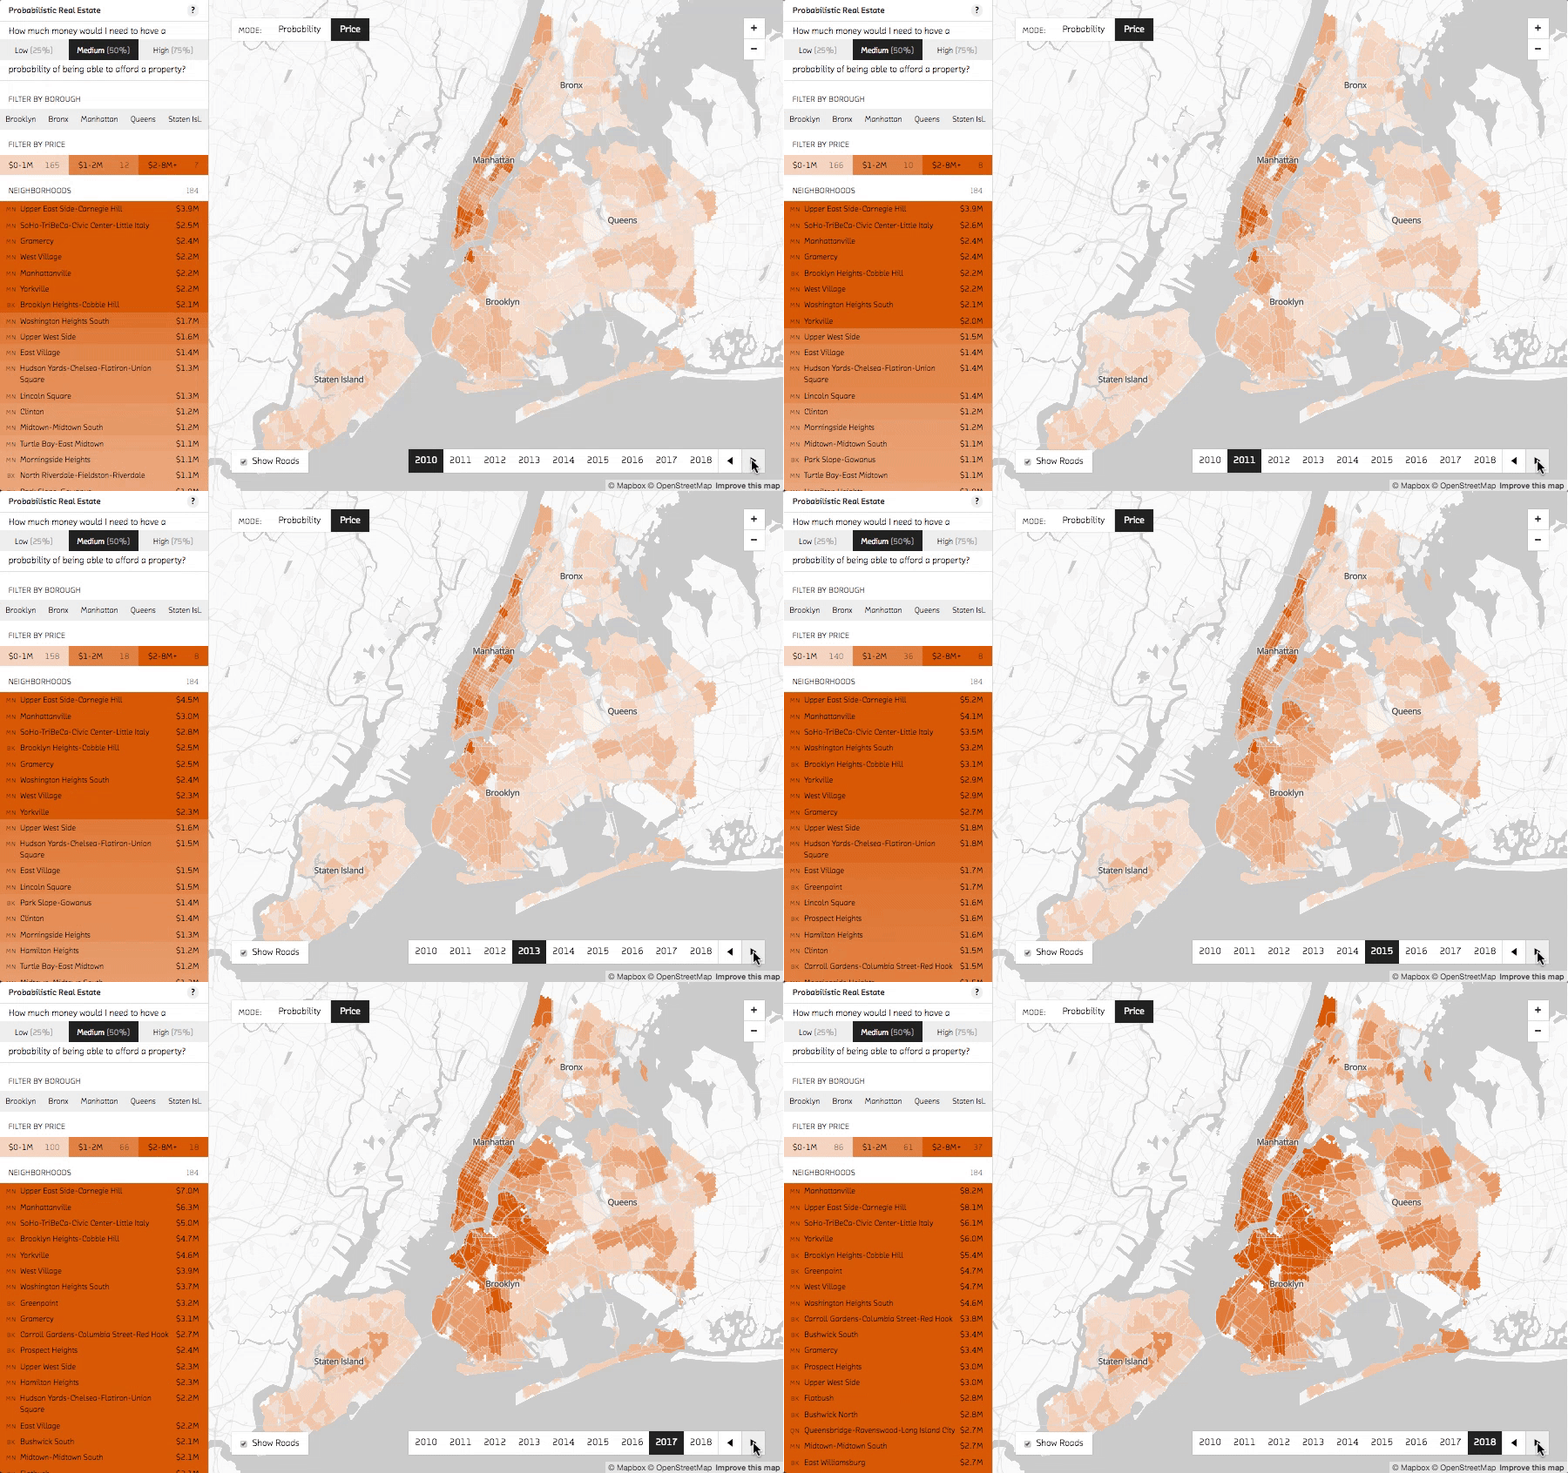
Changing years shows the change in median prices over time.
Use the year selector in the bottom right corner to cycle from the past (2010) to the predicted future (2018). You can see the dark orange of high median prices spread out from Manhattan further and further into the surrounding boroughs as the years progress.
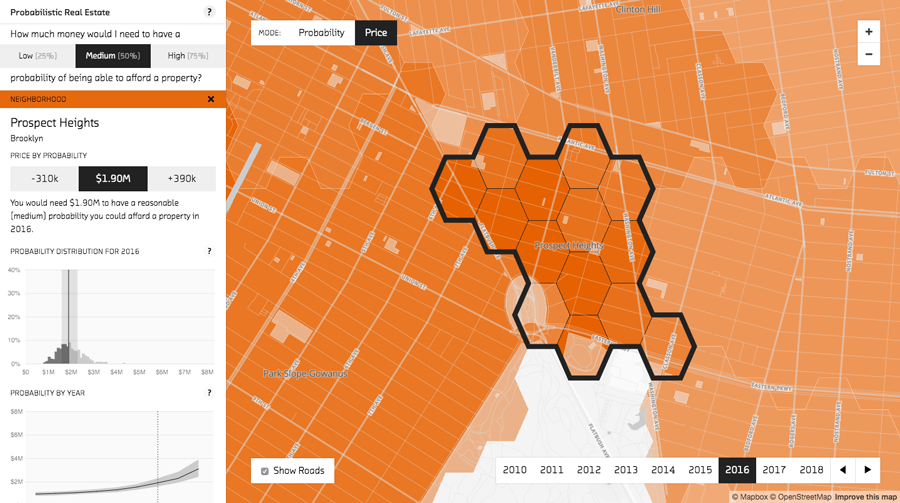
The neighborhood detail view shows the probability distribution for the selected neighborhood.
Clicking on a neighborhood reveals a more detailed view. A map of hexagonal groups (roughly five blocks each) provides more geographically specific price predictions. The graphs on the left reveal the strengths of the probabilistic approach by showing not just the median price, but the entire probability distribution. This distribution is calculated using samples generated by the model. Each sample can be considered a simulation of the way events could play out in a world described by our model. The prices for the 25th and 75th percentiles are highlighted, showing the range of likely prices. How close those percentiles are to the median predicted price is partly an indication of forecast uncertainty. In the “Probability by Year” chart they move farther apart in future years where the uncertainty grows.
Probabilistic Possibilities: Probability Mode
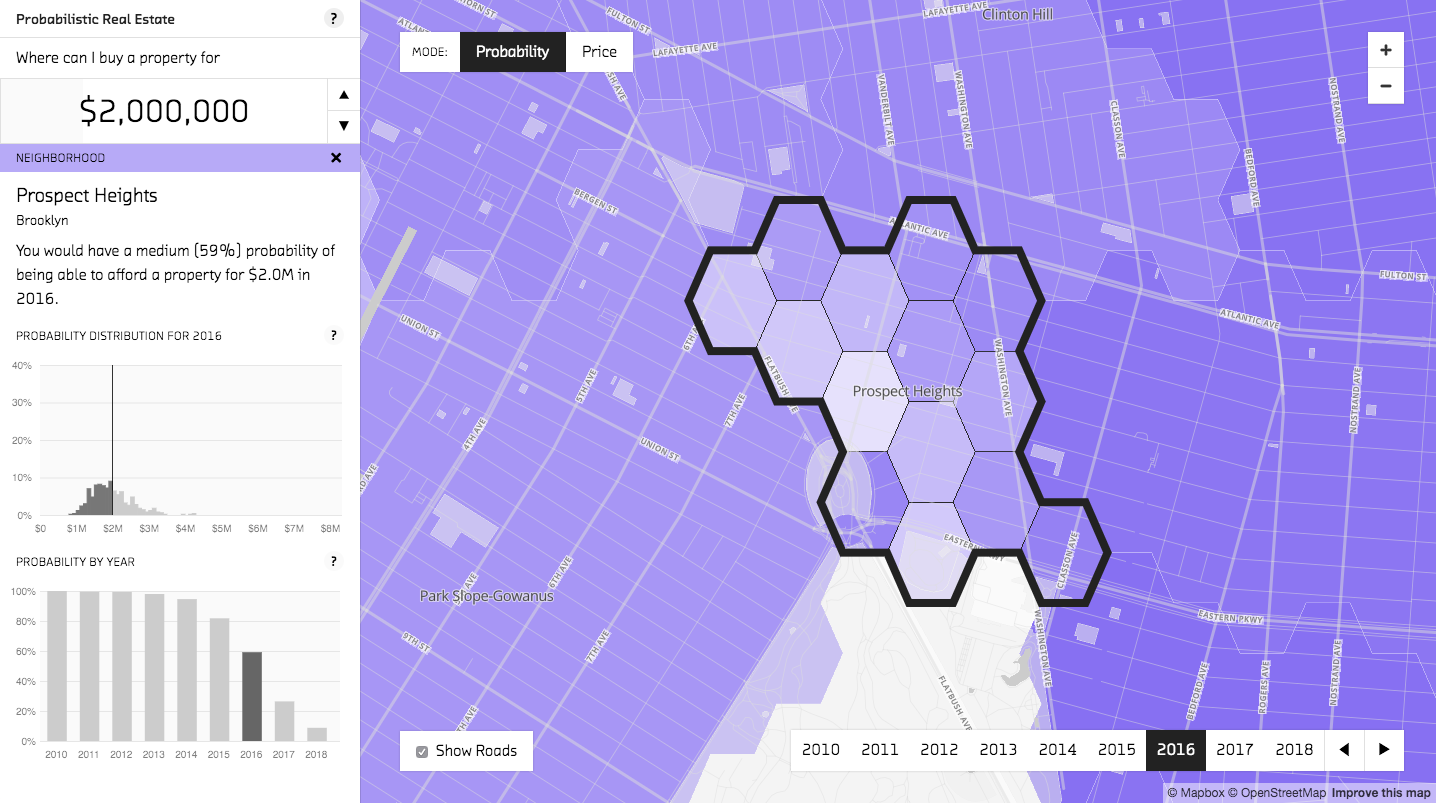
In probability mode, the neighborhood detail view shows how the selected price impacts the probability you would be able to afford a property in that neighborhood.
The possibilities of utilizing the entire probability distribution are further explored in probability mode, the prototype’s other, less conventional, mode. Price mode gives you a sense of real estate price dynamics across the city. Probability mode is more focused. It allows you to choose an amount of money and then uses each neighborhood’s probability distribution to show your chances of being able to afford a property within that neighborhood.
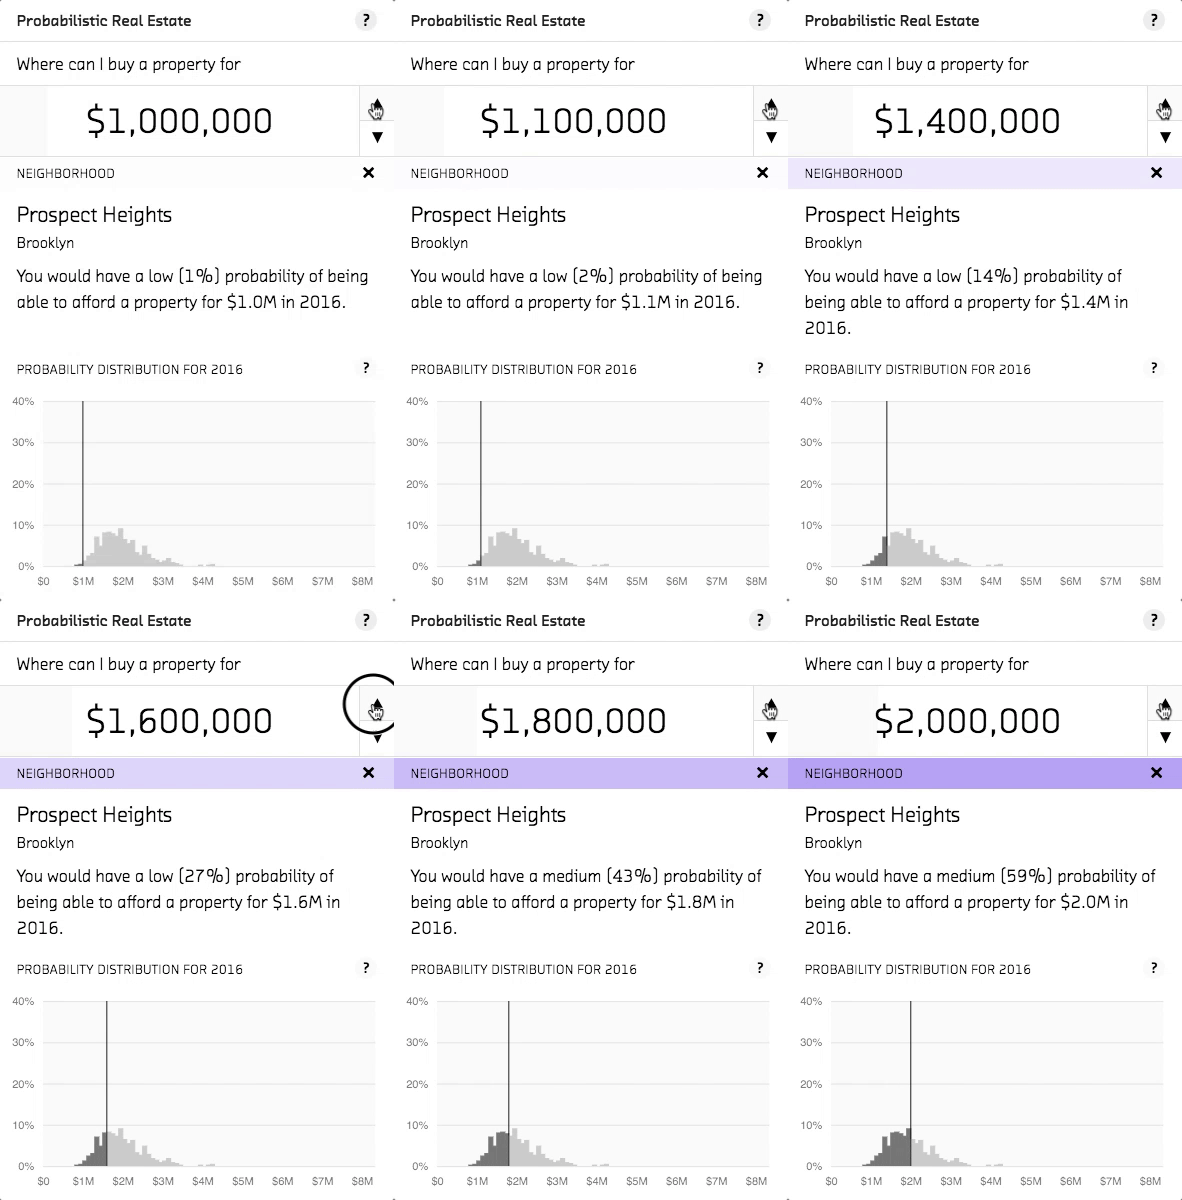
When you change the price, the probability is recalculated using each neighborhood’s probability distribution.
The probability calculation is visualized very clearly in the neighborhood detail graph. The black line is the selected price: based on your criteria, you can afford all samples less than that price (to the left of it). The probability that you could afford a property within that neighborhod, then, is represented by the set of samples less than the selected price divided by the total number of samples. Use the graph to see that how much paying an additional $100,000 improves your chances depends on where the selected price is in the distribution. In Prospect Heights in 2016, going from $1.1M to $1.2M improves your chance of affording a property by 2% (from 2% to 4%), while going from $1.7M to $1.8M increases your chance by 7% (from 35% to 43%).
While we chose to frame the neighborhood probability as how likely it is you would be able to afford a property in that neighborhood, you could also look at it as a prediction of the percent of properties for sale in that neighborhood that you would be able to afford. In this model, they are the same thing.
Comparing the shapes of the probability distributions across different neighborhoods also provides valuable information. A flatter distribution can indicate both a wider variety of prices in that neighborhood and a greater degree of uncertainty.
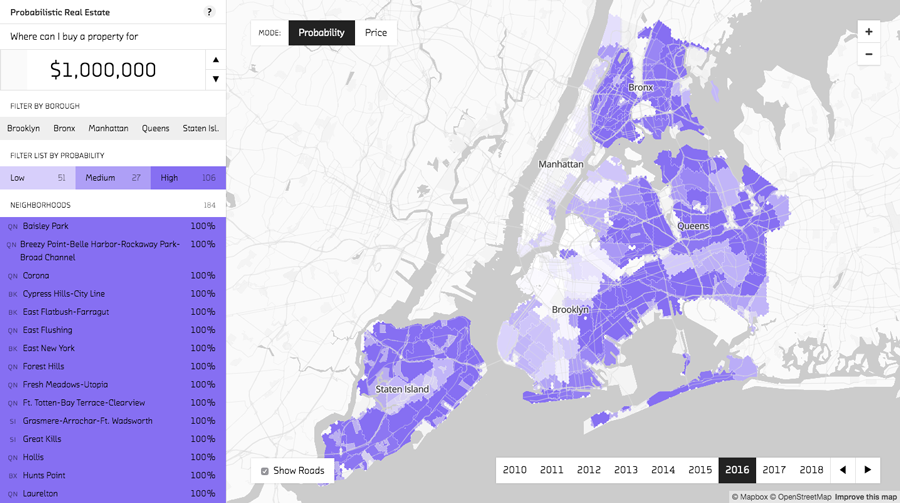
In probability mode, the probability for each neighborhood is calculated using that neighborhood’s probability distribution.
Returning to the overview of the neighborhoods in probability mode, we see something that looks roughly like the inverse of the price mode overview we started with. This makes sense: as probability mode focuses on where you could afford property, it highlights neighborhoods with lower prices. As we just saw, however, the calucations here are subtler then you might initally suspect. Your chance of affording a property in each neighborhood is calcuated using the entire probability distribution, allowing for different results across neighborhoods with different distribution shapes.
Go Explore!
In this post we showed some of the product possibilities opened up by probabilistic programming’s ability to quantify probabilities. Now that you’ve heard a bit about that from us, we hope you explore the Probabilistic Real Estate prototype to get a feel for it in practice. Here are some questions to get you started:
- What is the probability you could have afforded a property in Prospect Heights, Brooklyn in 2010 if you had $1m dollars? What is it in 2016?
- If you have $1.5m in 2016, in what Manhattan neighborhood are you most likely to find a property you can afford?
- How much money would you need to have an reasonable (medium) probability of affording a property in Brooklyn Heights-Cobble Hill, Brooklyn in 2016? How about in the West Village?
- In what part of Astoria, Queens are you most likely to be able to find a property for $1m in 2016?
- If current trends continue, how much would you need to have a reasonable (medium) chance of affording a property in Bedford, Brooklyn in 2018? How does that compare to past years?
Beyond Real Estate
The usefulness of probability distributions extends well beyond real estate prototypes. Read our interview with Thomas Wiecki to see how they can be used in predicting stock market behavior, and keep an eye on this blog for an upcoming post on how we used probabilistic programming to model the likelihood of loan repayment.


