Feb 14, 2018 · fast forward food labs
Probabilistic Cookies!
In the spirit of Valentine’s Day, we at Fast Forward Labs thought it would be fun to bake cookies for our sweethearts. Being DIY nerds, we thought we’d math it up a bit.
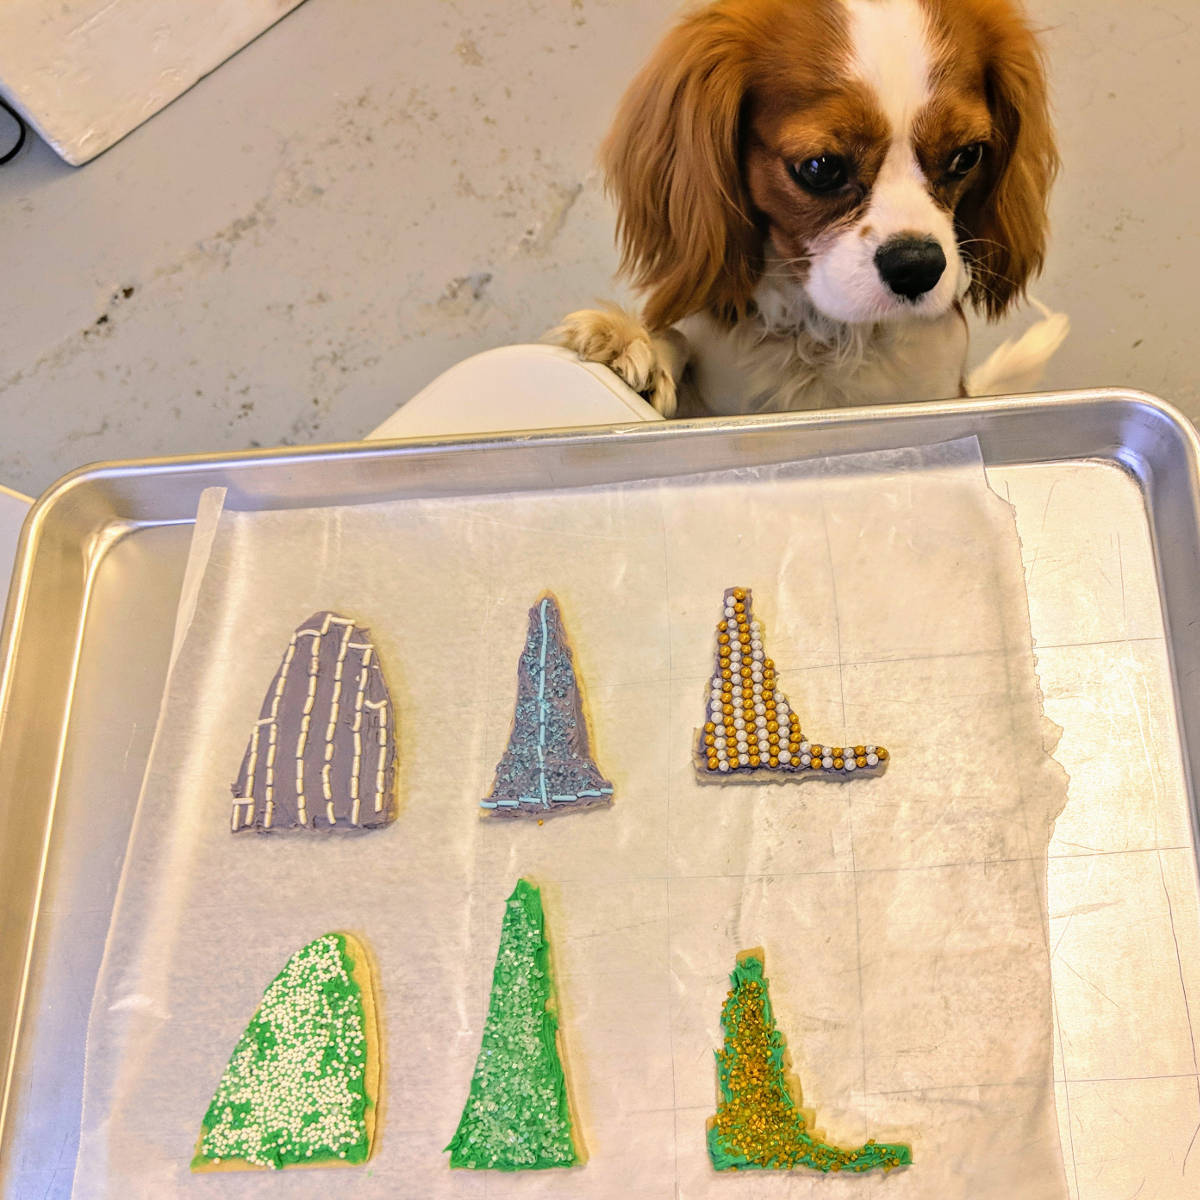
We used python to generate probability distributions and matplotlib to check our distributions. Then we wrote a python function to generate a SCAD file defining three-dimensional shapes from the distributions. Using OpenSCAD, an open-source CAD program, we checked the 3D models and exported them to STL files for printing. We used a 5th Generation MakerBot Replicator to print our 3D models. And we baked cookies. Here’s one of our office dogs (and my best friend), Dogface, admiring the results.
There were a number of challenges involved in generating 3D models and printing them. Here’s how the basic process went.
We chose a beta distribution for our first prototype because it’s well behaved for purposes of making a 3D printed object.
- A beta distribution only has values from 0 to 1. This gives us a fixed-width shape to work with. (Compare a Gaussian distribution, which has long tails on both sides and thus may not normalize to a good shape across 0 to 1.)
- The area under the curve of a beta distribution is necessarily 1, which helps keep the shape from getting too eccentric while allowing flexibility in choice of parameters, and thus a wider range of shapes.
- If you take two beta distributions, put them x-axis to x-axis, and squint, they look a bit like a heart.
We created a beta distribution in python.
import numpy as np
from scipy.stats import beta
import matplotlib.pyplot as plt

# choose enough points to have a relatively smooth curve without
# creating so many facets that the 3D printer is slow
#
# choose an odd number so there is a definitive peak to the curve
numpoints = 35

# set up linspace
X = np.linspace(0, 1, numpoints)

# beta distribution parameters
a, b = 2, 1.6

# get beta distribution array
betadist = beta.pdf(X, a, b)
And plotted that distribution with some suitable parameters.
# turn off the axes so we only see the curve
plt.axis('off')

# plot the curve itself
plt.plot(X, betadist)
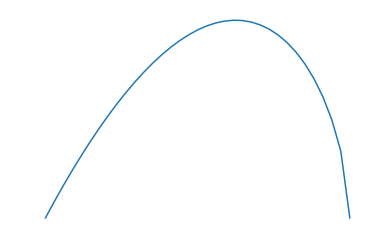
Once we found a set of parameters that we liked, we used the points in the distribution in python to create an OpenSCAD-formatted SCAD file. A SCAD file is a readable text file that contains a combination of points in space that define shapes and instructions to manipulate those shapes. We made two 2D copies of the distribution, sized one up a bit, and centered them together. We extruded them both into 3D, one linear, and the other with a slight “cone” projection. This gave us one relatively thin edge for piercing cookie dough. Then we subtracted one shape from the other to make a hollow in the larger shape. Rendered in 3D in OpenSCAD, it looks like this:
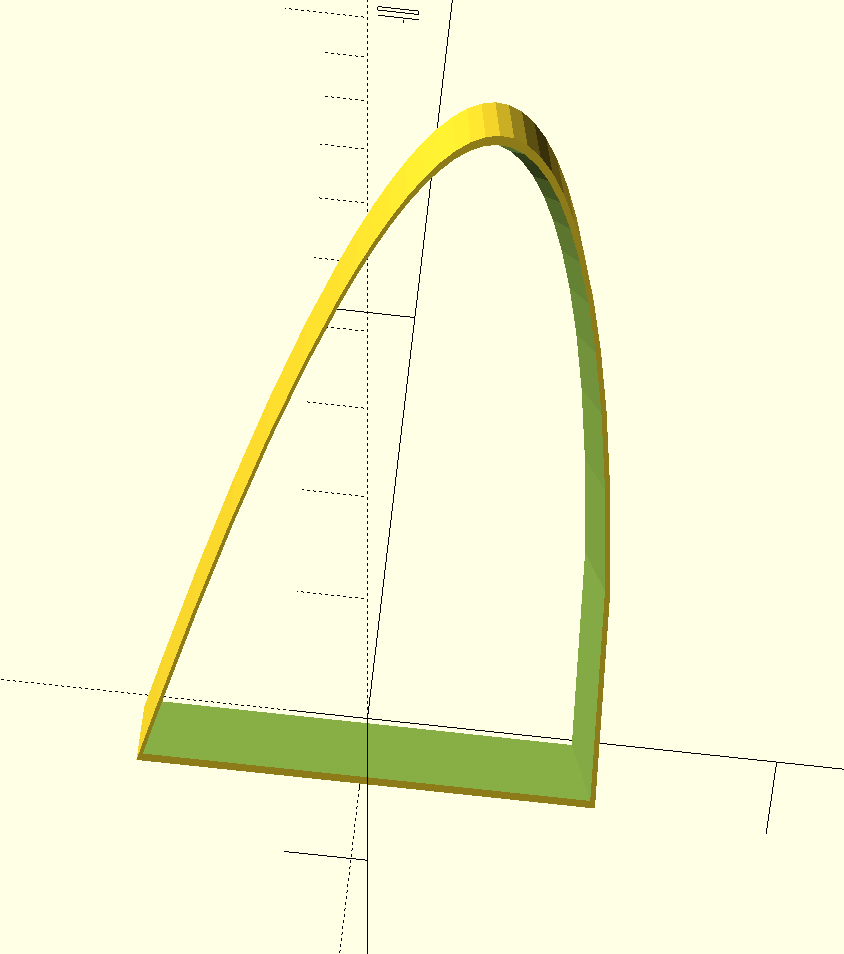
Note that the 3D model looks more eccentric than the python-generated plot. This is because the plot had axes of differing scales.
With a 3D model in hand, it was time to print a physical object. We exported our SCAD object into a stereolithography (STL) file, which we then imported into MakerBot’s printing software.
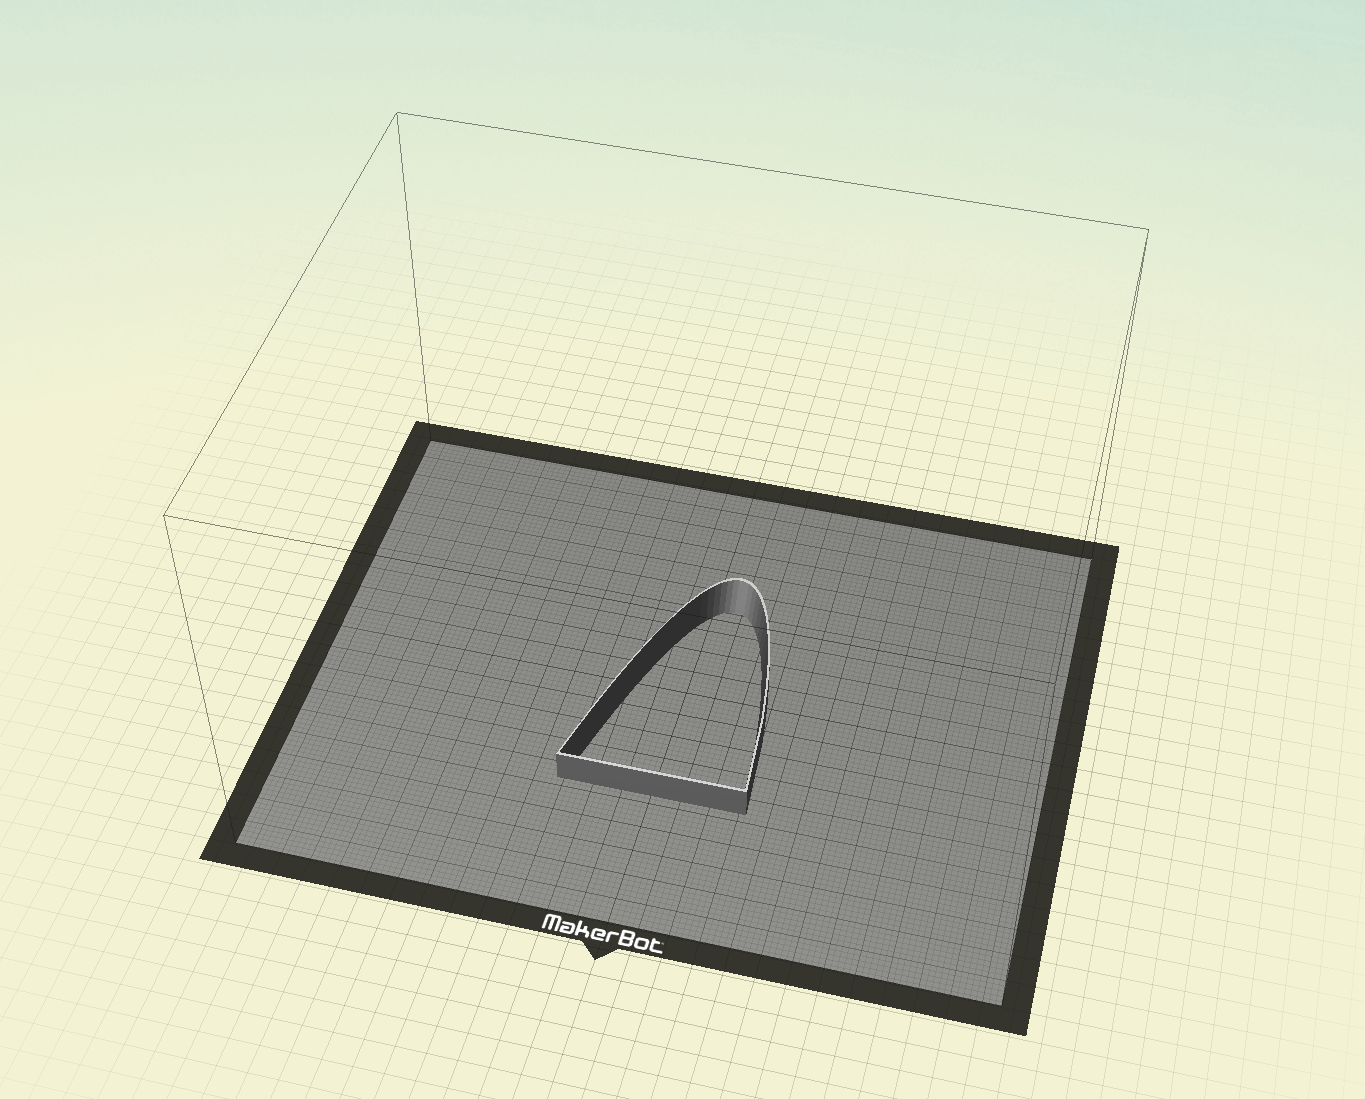
We made a final print file and extruded our first prototypes at NYC Resistor our friendly neighborhood hackerspace. 3D printing can take a while for large shapes, so we started out small.
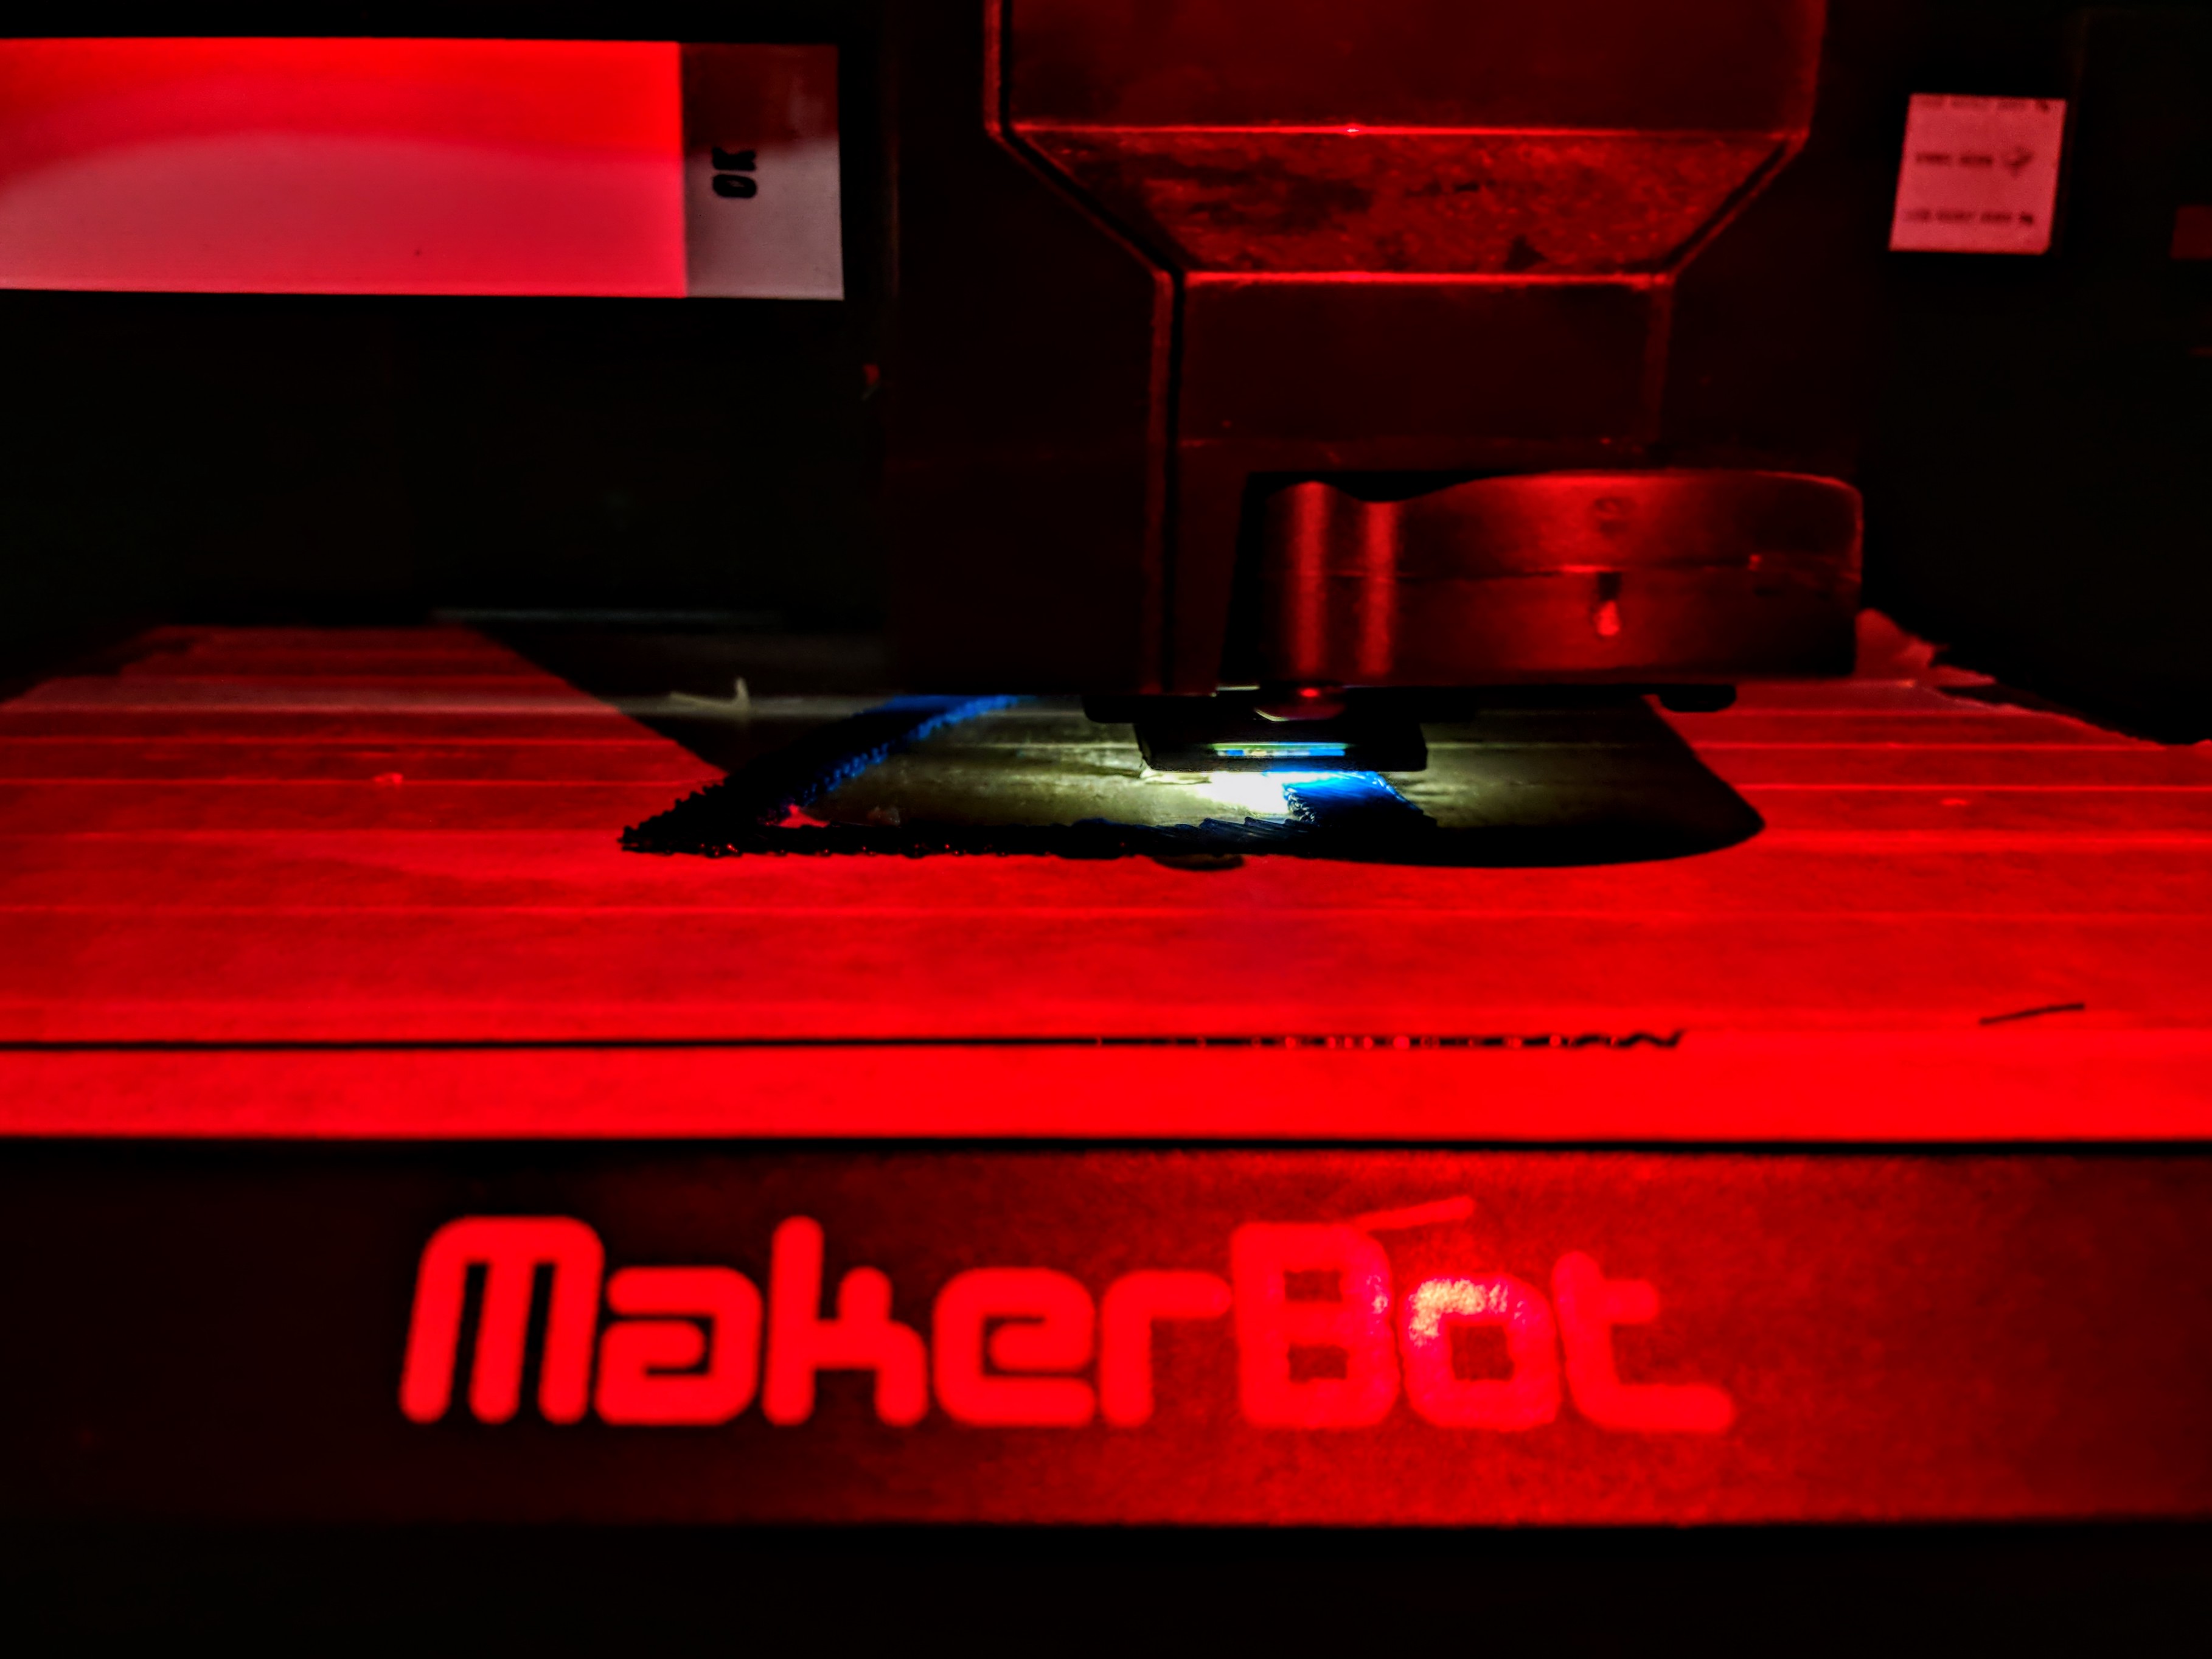
Here are the first results (we had begun tinkering with a Gaussian distribution at that point):
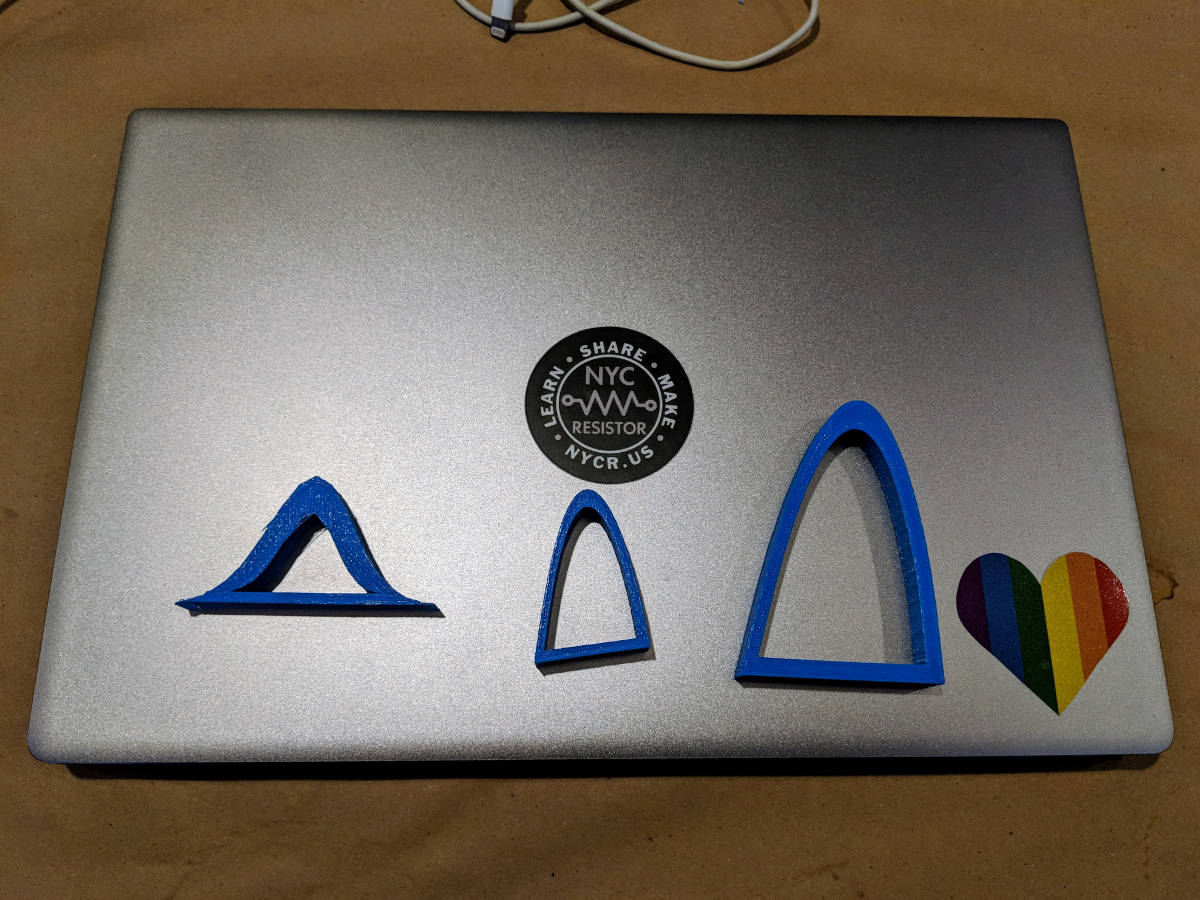
Of course these first test shapes are too small for cookies. After a lot of tinkering and refinement, we ended up with beta, Gaussian, and Poisson distribution shapes scaled up for cookie size (about 100mm high).
We made some cookie dough and got to business.
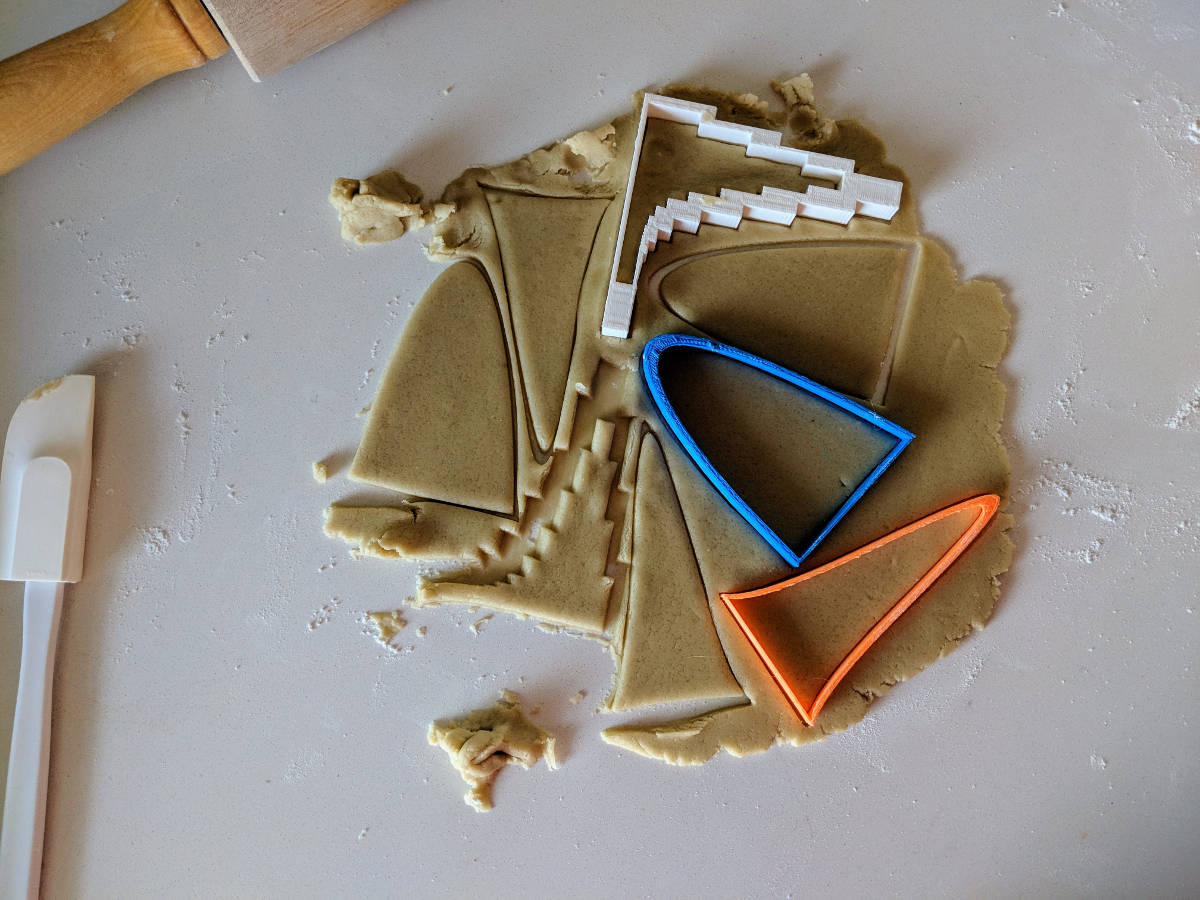
Note that the Poisson distribution (printed in white) has big solid areas at the top. This makes it more of a cookie-dough perturber than a cookie cutter. Those solid areas are an artifact of my own ignorance of OpenSCAD. The “clever” OpenSCAD scale() approach I had been using was a hack; I later learned that the offset() function is the correct solution.
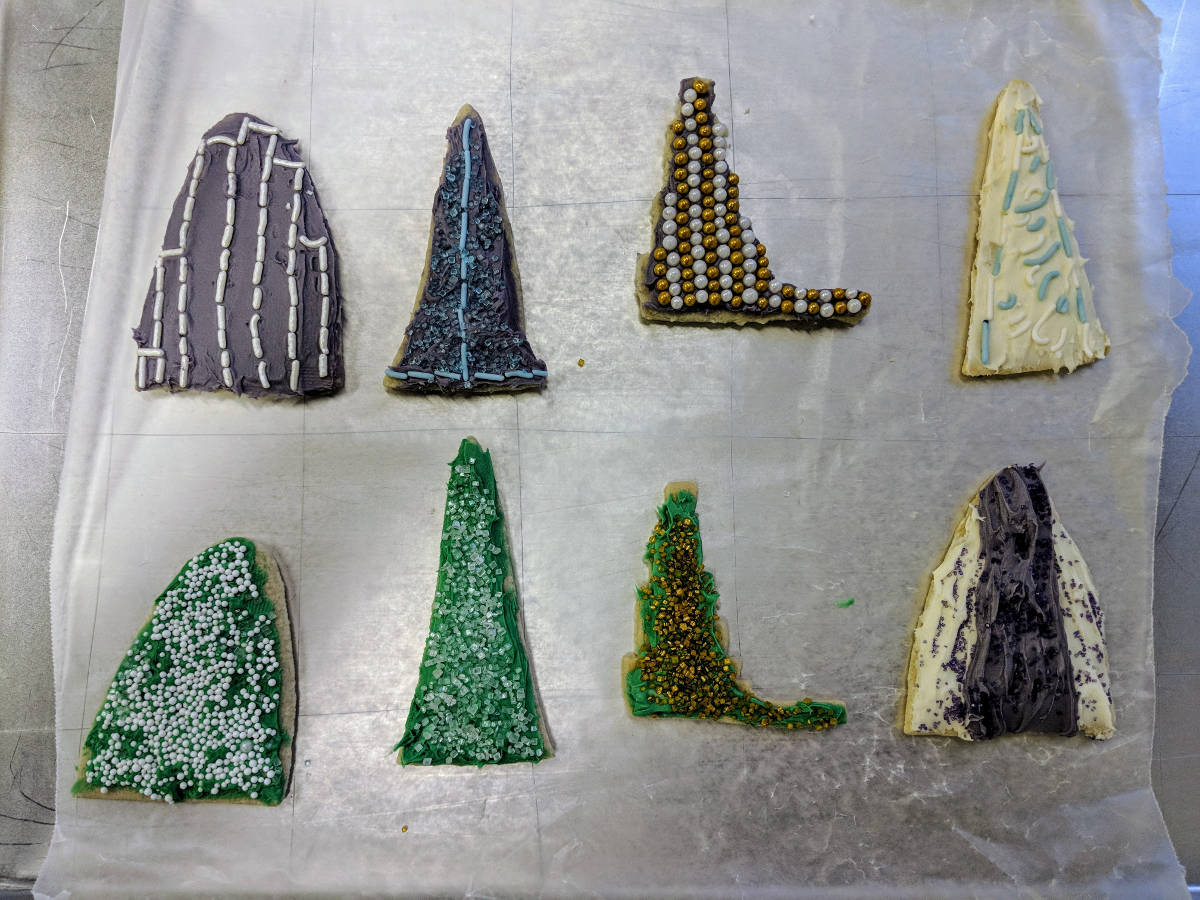
OpenSCAD issues aside, the cookies turned out fine. Here are some of the results, some decorated with axes and histograms.
If you feel inclined to give it a shot yourself, here’s a jupyter notebook with some code to get you started.
Happy Valentine’s Day from Fast Forward Labs!

