Aug 28, 2019 · newsletter
Two approaches for data validation in ML production
Machine learning models start to deteriorate once we deploy them. This is partly because real life data changes, and models need to be re-trained to maintain their performance. Typical ML pipelines re-train periodically (daily, for example) using newly available data. But how do we validate data fed into the pipelines to make sure tainted data does not accidentally sneak into the production system? Tainted data could cause system crashes or lead to slow degradation of model performance. The impact of the former is painful and immediate; the impact of the latter is perhaps more dreaded. It’s hard to debug and isolate.
Unit-tests for datasets
Amazon research (PDF) proposed a unit-test approach. The idea is to create a system that (i) allows users to (easily) define constraints (or checks) on the data, (ii) converts these constraints to computable metrics, and (iii) reports which constraints succeeded and failed, and the metric value that triggered a failure.

Example constraints (image source)
How does it work? Imagine some data as a set of log files generated by an on-demand video platform. The log contains information about platform usage, type of device, length of session, title, and customer id. This is ingested and used as training data for recommendation systems. To validate this data using the proposed system, the user defines a set of checks including (i) completeness and consistency (for example: customerID and title columns should have no missing values), (ii) uniqueness (for example: each row of combined customerID and title value should be unique), and (iii) counting (for example: number of distinct values in the title column should be less than the total number of movies in the system). Once the constraints are specified, the system converts them into actual computable metrics. For example, completeness would convert into a “fraction of non-missing values in a column” metric. The last step is to generate a report to show how all the constraints fared. The report also lists the ones that failed, along with the value that triggered a failure.

System architecture (image source)
Because new data comes in continously, the system uses a recursive computation approach that only looks at new data since the last time step to update the metrics incrementally. In addition, to lower the barrier of adoption, the system automatically suggests constraints for datasets. This is accomplished through clever use of heuristics and a machine learning model.
The heuristics approach employs single-column profiling - all the user needs to provide is a single table dataset with column names to start. The system then executes single column profiling in three passes; the goal is to figure out data size, data type, summary statistics (min, max, mean, etc.) and frequency distribution of the data. Based on the profiling results, the system recommends constraints based on a set of heuristics. For example, if a column is complete, the system suggests an isComplete constraint. If the number of distinct values in a column is below a threshold, the column is assumed to be categorical and the system suggests an isInRange constraint that checks whether future values are contained in the set of already observed values. The heuristic approach is complemented by a machine learning model. The model is trained to predict constraints based on table name, column name, and type. Finally, the system performs anomaly detection on historic time series of data quality metrics (for example: the ratio of missing values for different versions of a dataset). This can be done using either built-in or user-provided algorithms.
Data Schema applied to ML
In a separate paper (PDF), Google introduced a similar system, but one that relies on the concept of data schema to codify expectations for correct data. The system integrates into existing ML pipelines right after training data ingestion - training data is validated before being piped into a training algorithm. This system consists of three main components: a Data Analyzer that computes a predefined set of statistics that is considered sufficient to describe the data, a Data Validator that checks the data against a Schema, and a Model Unit Tester that checks for errors in the training code using synthetic data generated through the schema. The system can (i) detect anomalies in a single batch of data, (ii) detect significant changes between successive batches of training data, and (iii) find assumptions in the training code that are not reflected in the data (for example: taking the log of a feature that turns out to be a negative number).
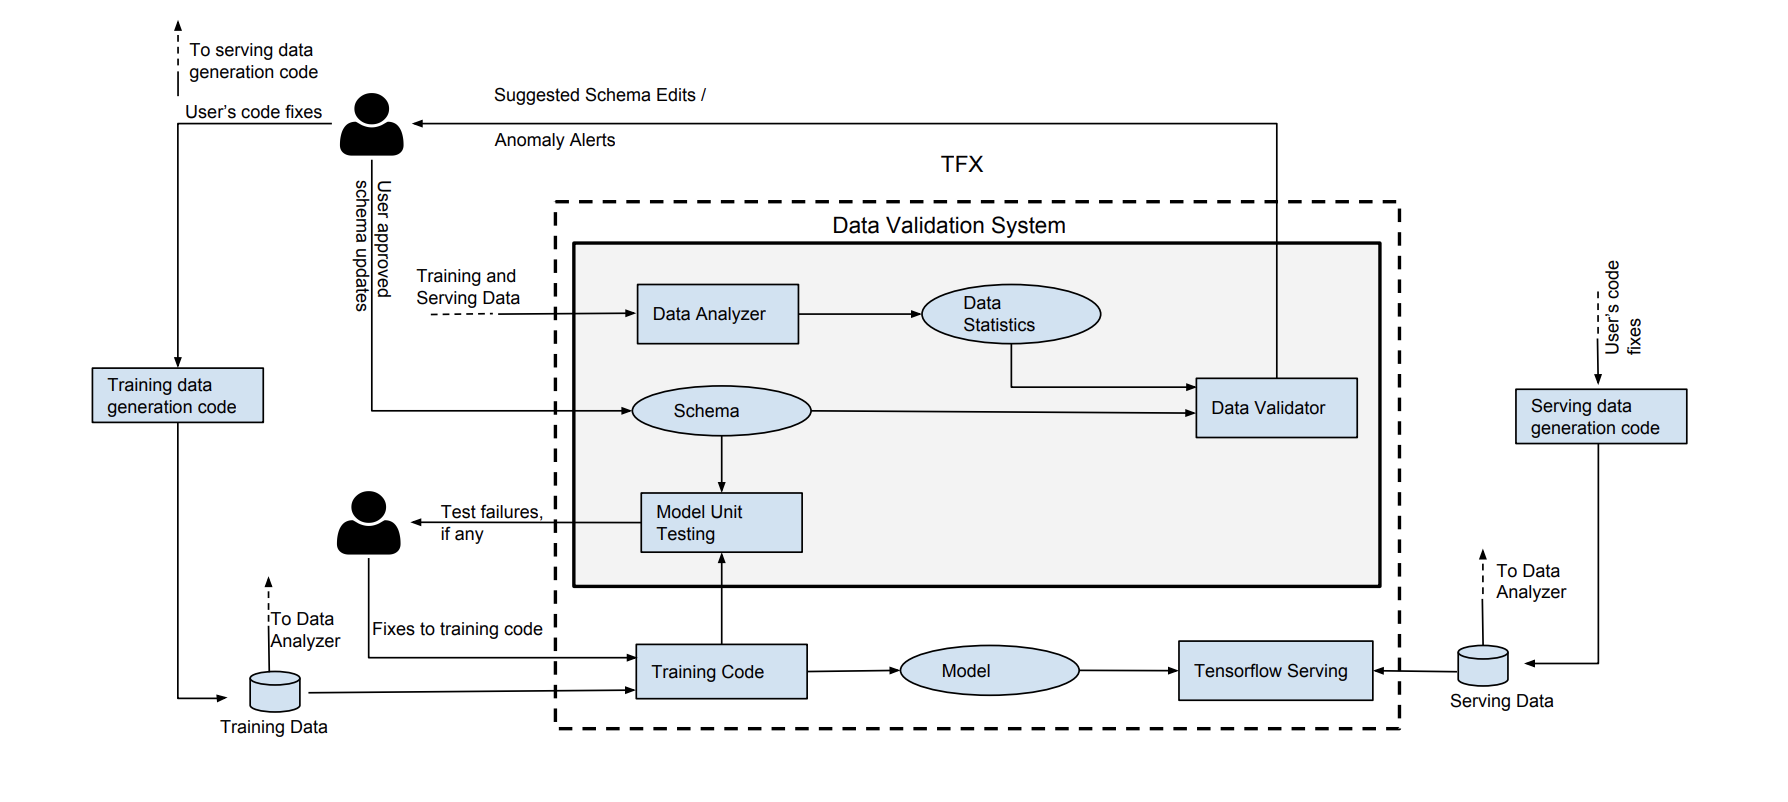
System architecture (image source)
In simple terms, a schema is just a logical model of the data. Because machine learning data typically consists of features, the schema would have a collection of features, and the constraints associated with each. These constraints include basic properties (for example: type, domain) and ML relevant ones. For example, we want a presence constraint to make sure features are not accidentally dropped. We also want a domain constraint to make sure country codes are always represented by upper-case strings. To overcome the adoption hurdle (constructing a schema manually is tedious!), a basic version of the schema is sythesized based on all available data in the pipeline by relying on a set of reasonable heuristics.

Schema example (image source)
Once we have the schema in place, the Data Validator validates each batch of data by comparing it against the schema. Any disagreement is flagged and sent over to a human for further investigation. In addition, the Data Validator also recommend updates to the schema as new data is ingested and analyzed. Users can easily apply or edit the suggested changes using a click-button interface.
Some anomalies only manifest when we look across multiple batches rather than focusing on a single batch in isolation. Distribution skew, for example, occurs when the distribution of feature values of a batch of training data is different from that seen at serving time. To detect this type of anomaly, the system relies on metrics that can quantify the distance between the training and serving distributions. Metrics such as KL divergence or cosine similarity can be used, but they rely on setting a threshold; anything that crosses the threshold is considered an anomaly. Unfortunately, this threshold needs to be tuned, and product teams have a hard time building intuition for what this threshold actually means. The proposed system thus uses a different metric that comes with a natural interpretation: it sets the largest allowed change (in probability) for a particular value. With this metric, teams can say “allow changes of up to 1% for each value” rather than having to a set an obscure threhold for KL divergence.
Lastly, the system builds in model unit testing - it catches mismatches between the expected data and the assumptions made in the training code. Imagine a scenario where the training code applies a log computation on a numeric feature. This implies that the feature’s value is always positive, but if the schema does not encode this assumption, how do we catch this type of error? The proposed system uses a fuzz testing approach. First, synthetic training examples that adhere to the schema constraints are generated. Second, this generated data is used to drive a few iterations of the training code. The goal is to trigger hidden assumptions in the code that do not agree with schema constraints.
Both approaches are used in actual production systems at Amazon and Google and seem to be impactful. As enterprises put more machine learning models into production, monitoring the quality of data that feeds into these models becomes even more important. Data needs to be elevated to a first-class citizen in ML pipelines, and not just in the model development stage!


