Sep 26, 2017 · post
The Product Possibilities of Interpretability
This post is part of a series highlighting the importance of interpretability. Previous posts include a video conversation on interpretability, a guide to using the LIME technique to predict whether couples will stay together, and a look at the business rationale. In our post on FairML, we used interpretability techniques to identify discriminatory bias in algorithms.
As the use of machine learning algorithms increases, the need to understand them grows as well. This is true at both a societal and a product level. As algorithms enter into our workplaces and workflows, they can appear mysterious and intimidating. Their predictions may be precise, but the utility of those predictions is limited if we cannot understand how they were reached. Without interpretability, even accurate algorithms are poor team players—technically correct but uncommunicative.
Interpretability opens up opportunities for collaboration with algorithms. During their development, it promises better processes for feature engineering and model debugging. After completion, it can enhance users’ understanding of the system being modeled and advise on what actions to take.
The Refractor prototype shows how different attributes affect a customer’s likelihood to churn.
For our prototype, we wanted to explore how that collaboration through interpretability might look. We chose an area, churn probability for customers of an internet service provider, where the collaboration payoff is high. The base of the prototype is a supervised machine learning model of customer churn (how likely a customer is to unsubscribe) trained on public data. Making the churn prediction is the kind of problem machine learning excels at, but without an understanding of what features are driving the predictions, user trust and ability to take action based on the model are limited. With interpretability, we can break out of those limitations.
Our prototype, Refractor, explores how interpretability can be visualized. It guides the user through two levels of interpretability, from a global table view of customers to an exploration of the effects of different features on an individual user. The process of building the prototype was also a movement between, and eventually a balancing of, those two levels.
Global View: Understanding the Model
Refractor uses LIME to explore which features are most affecting the model’s prediction. LIME is focused on local explanation of feature importance through feature perturbation. It may initially seem a strange choice, then, to use it in a globally oriented view. The stacked local interpretations, however, coalesce into a powerful global representation of how the algorithm works. For many complex algorithms, this is the only kind of global view you can have.
The global table displays the churn probability prediction (calculated by the model) and highlights in red and blue the importance of different features in making that prediction (as calculated by LIME). Columns can be sorted by value to explore the relationships across customers.
Machine learning models are powerful because of their ability to capture nonlinear relationships. Nonlinear relationships cannot be reduced to global feature importance without significant information loss. By highlighting local feature importance within a table view, you do see important columns begin to emerge, but you can also observe patterns, like discontinuities in a feature’s importance, that would have to be averaged out if feature importance was globally calculated.
The table, as a sort of global view of local interpretability, highlights how interpretability depends on collaboration. The intuitive feel a user builds up from scrolling through the highlighted features depends on our ability to recognize patterns and develop models in our heads that explain those patterns, a process that mirrors some of the work the computer model is doing. In a loose sense, you can imagine that the highlighted features give you a glimpse of how the model sees the data—model vision goggles. This view can help us better debug, trust, and work with our models. It is important to keep perspective, however, and remember that the highlighted features are an abstracted representation of how the model works, not how it actually works. After all, if we could think at the scale and in the way the model does, we wouldn’t need the model in the first place.
Local View: Understanding the Customer
While the table view is a powerful interface, it can feel overwhelming. For this prototype, we wanted to complement it with an individual customer view that would focus on actions you could take in relation to a specific customer.
The individual customer view shifts the focus from comparisons across customers to one particular customer.
Free of the table, we are now able to change the displayed feature order. The obvious move is to sort the features by their relative importance to the prediction. In the vertical orientation, this creates a list of the factors most strongly contributing to the customer’s likelihood of churning. For a customer service representative looking for ways to decrease the chance the customer will leave, this list can function as a checklist of things to try to change.
Using LIME, we can sort customer attributes by their relative importance to the churn prediction.
Because this sorting is an obvious move, it’s easy to undervalue its usefulness. It is worth remembering that without LIME (or a different interpretability strategy), the list would remain unsorted. You could manually alter features to see how the probability changed, but it would be a long and tedious process.
The implicit recommendations of the feature checklist are built upon with further information. The recommendation side panel highlights the top three and uses the model to calculate the percent reduction in churn probability that changing each feature would have.
The recommendation sidebar highlights the top possible churn reduction actions.
As the user follows these recommendations, or explores by changing other feature values for the individual customer, we not only calculate the new churn prediction, we also calculate the weights based on the new feature set. This ability to change one feature value and see the ripple effect on the importance of other features once again helps the user build up an intuitive feeling of how the model works. In the case of a customer service representative with an accurate model, that intuitive understanding translates to an ability to act off of its insights.
Product Tension: Focus vs. Context
As we developed the global and local interfaces of the prototype, we constantly engaged with a tension between providing the user with context and providing a focused and directed experience. This tension will arise any time you are adding interpretability to a model, and requires careful consideration and thought about the purpose of your product.
In the early stages of prototype development we kept all of the features visible, using color and ordering to emphasize those with higher importances. As we probed how a consumer product using LIME might work, we explored only showing the highest-importance features for each customer. After all, if you’re a customer service representative concerned with convincing a user to stay, why would you need to know about features that, according to the model, have no discernible effect on the churn prediction?
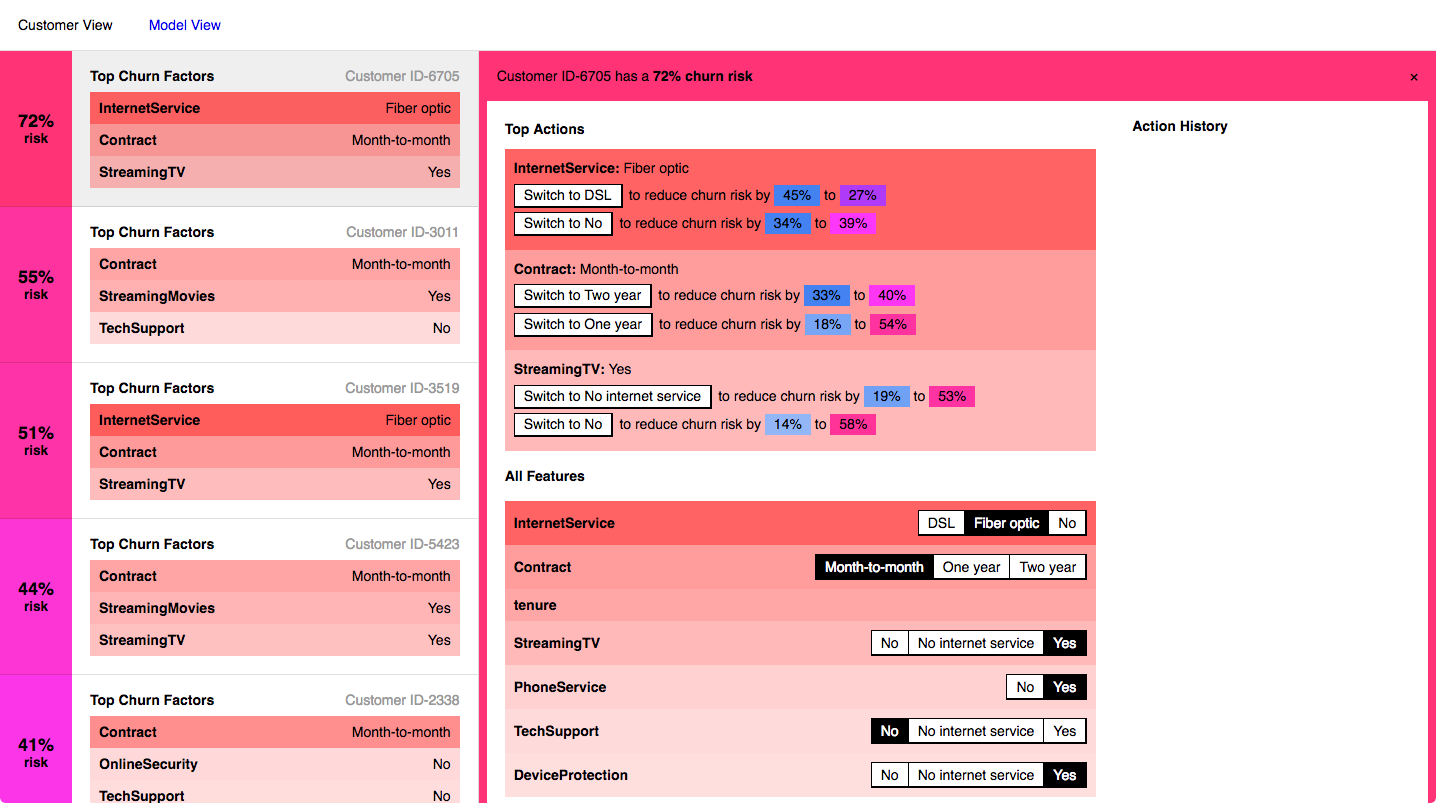
Early interface experiments displayed only the top three features for each customer. The view was focused but provided the user with less context to understand the model.
We experimented with interfaces emphasizing just the top features, and they did have the benefit of being more clear and focused. However, the loss of context ended up decreasing the user’s trust and understanding of the model. The model went back to feeling more black box-like. Being able to see which factors don’t make contributions to the prediction (for example, gender) and checking those against your own intuitions is key to trusting the features that are rated of high importance.
Having seen the importance of context, we decided to focus our prototype on that, while also dedicating some space to a more focused experience. In the individual view, this means that along with the full list of features we show the more targeted recommendation panel. For a customer service representative, this recommendation panel could be the primary view, but providing it alongside the full feature list helps the user feel like they’re on stable ground. The context provides the background for users to take more focused action.
Collaborating with Algorithms
Trust is a key component of any collaboration. As algorithms become increasingly prevalent in our lives the need for trust and collaboration will grow. Interpretability strategies like LIME open up new possibilities for that collaboration, and for better and more responsible use of algorithms. As those techniques develop they will need to be supported by interfaces that balance the need for context with a focus on possible actions.


