Oct 4, 2017 · post
First Look: Using Three.js for 2D Data Visualization
Update: I have a new post on Using three.js for 2D data visualization. It contains all the stuff I learned while working on the project and is the place you should look for updated code. This post may still be interesting if you want to see my thoughts when I first started on the project.
We’ve started work on our next prototype. While the design is still evolving, we’re pretty sure one element of it will be a visualization of tens of thousands of data points, clustered through a dimensional reduction algorithm (most likely using T-SNE). For the past week I’ve been exploring how to render that many points in the browser and I wanted to document some early lessons in this post, specifically about using the three.js library.
I’m new to three.js so this isn’t a best practices post. Hopefully this provides a starting point for people interested in doing similar data visualization work. If you have ideas on how to do this stuff better, I’d love to hear them via Twitter (@grantcuster).
What I’m after
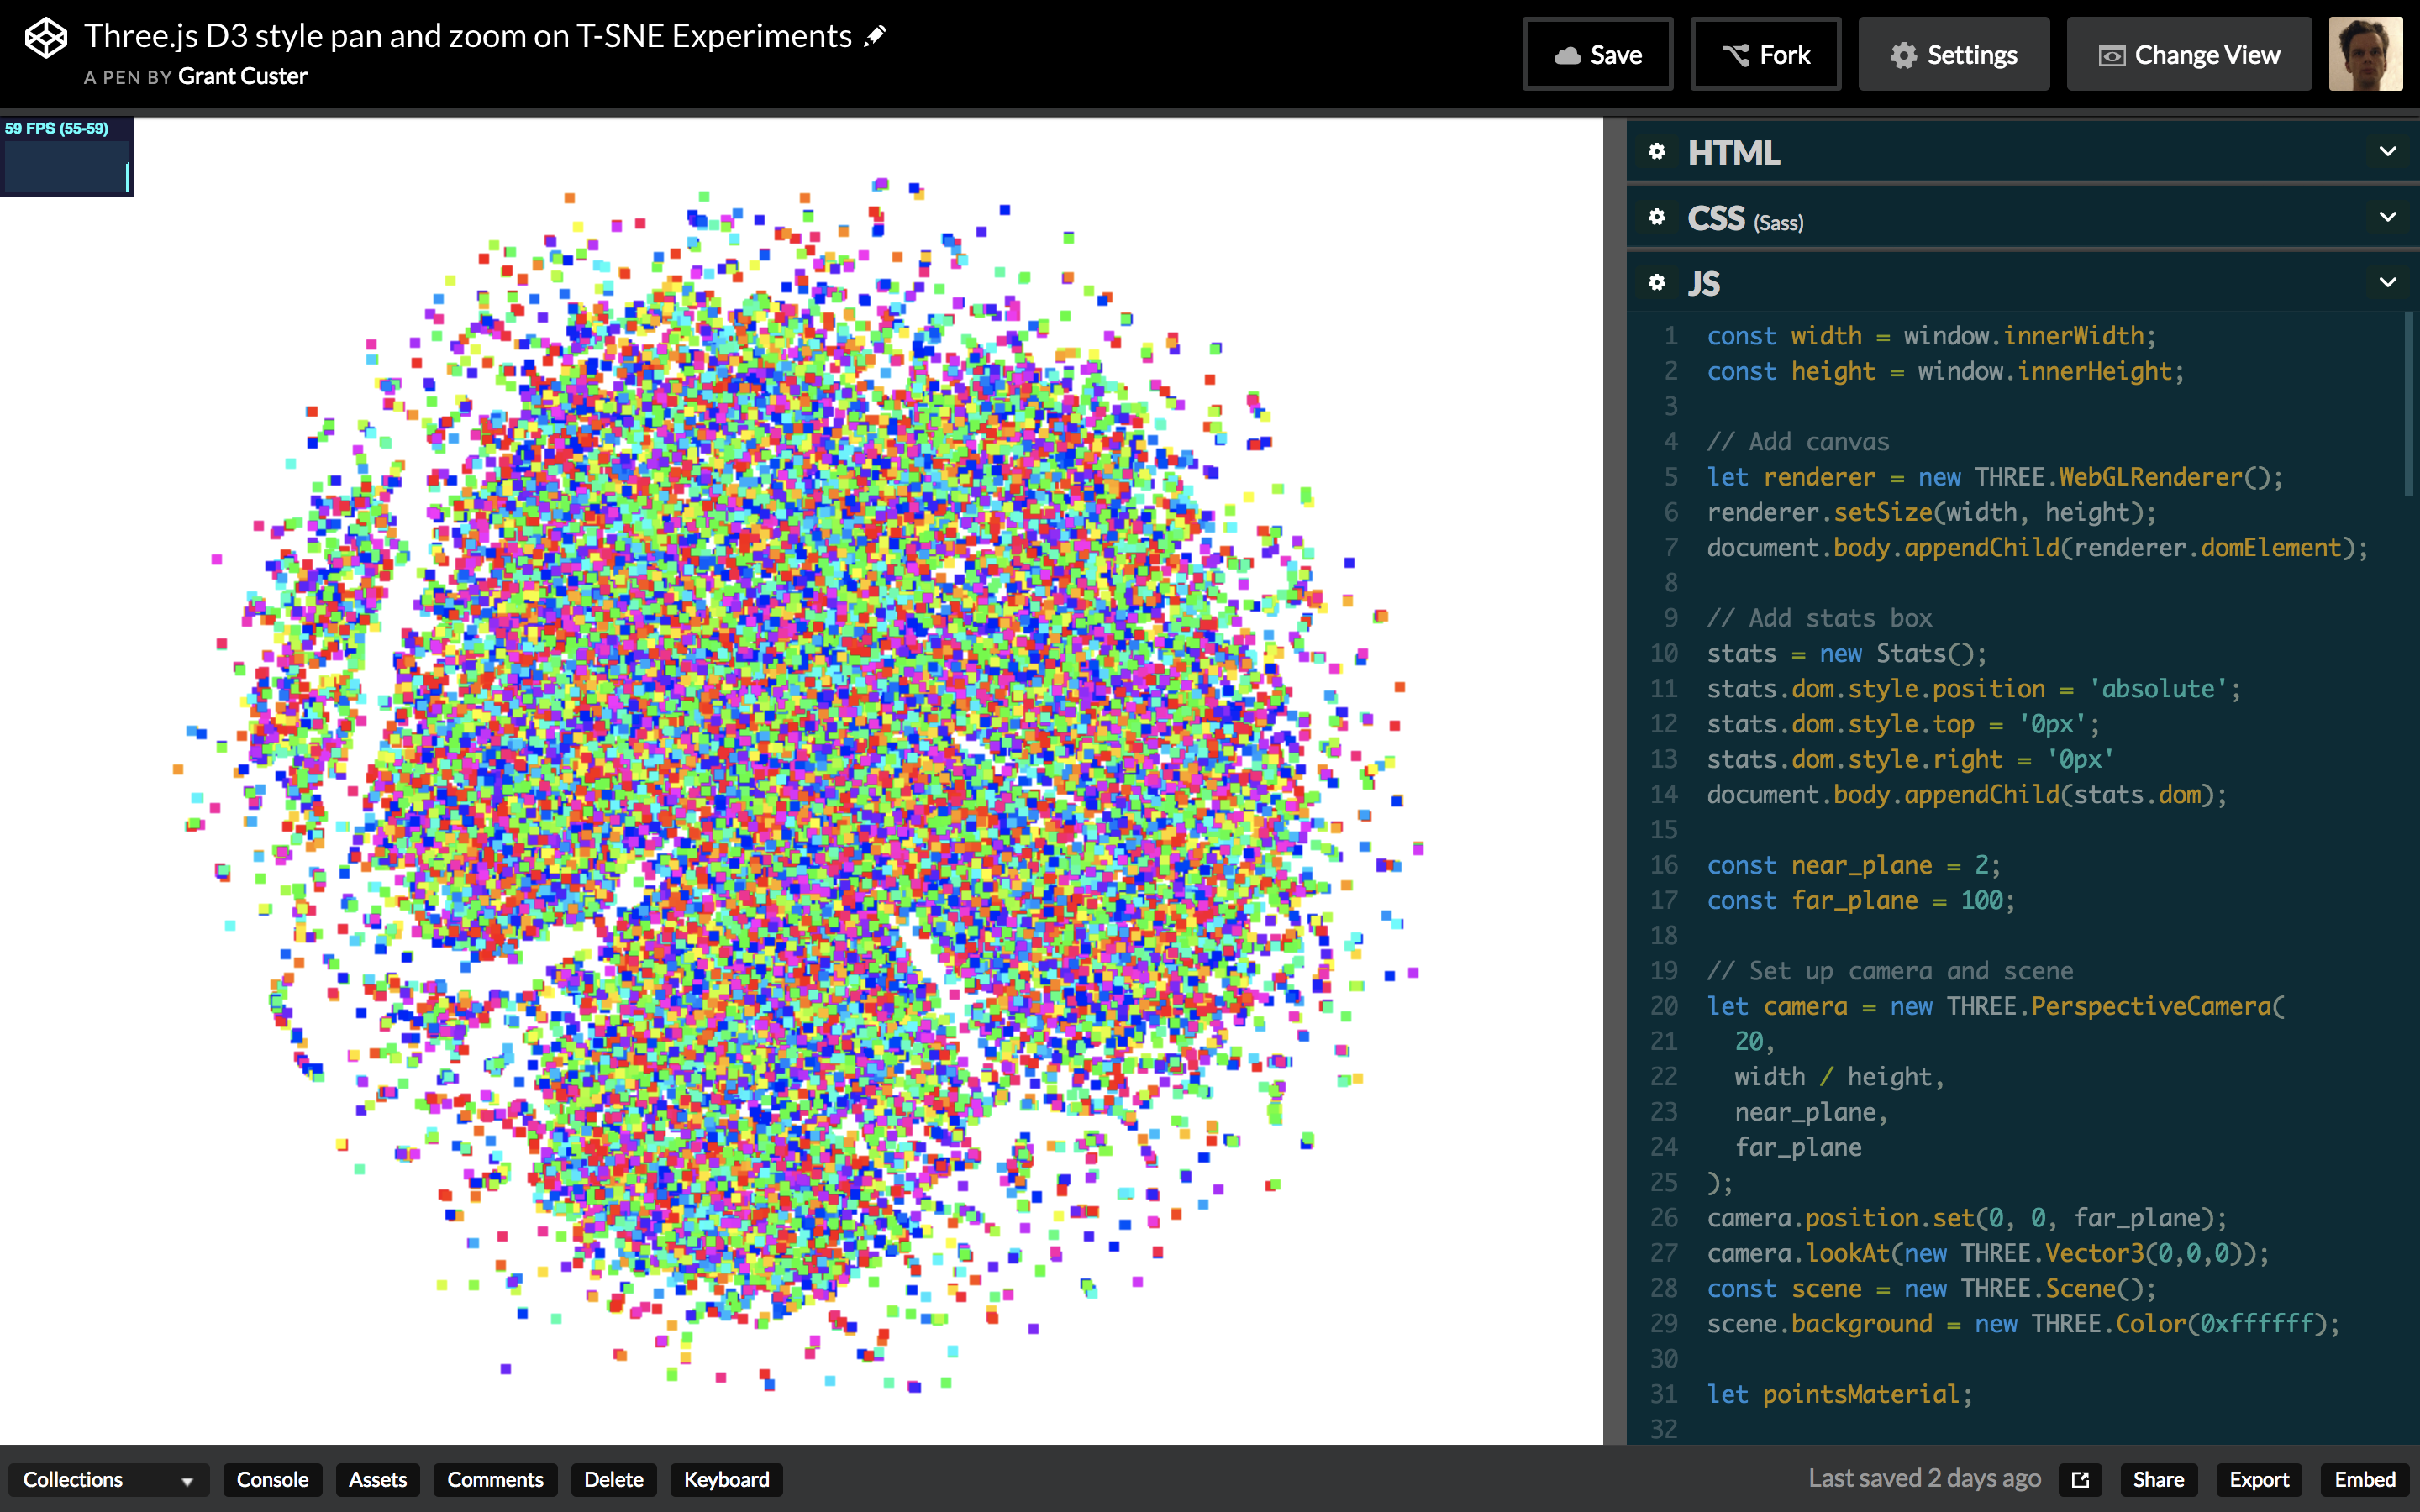
The final result: a T-SNE rendered in three.js with a map style pan and zoom.
I want to render a visualization with tens of thousands of points. I want to be able to zoom into that visualization by scrolling and pan by clicking and dragging (think Google Maps). I want the zoom to follow the position of the mouse and I want that zoom to feel smooth and responsive. I also want the browser to not crash when I do those things.
Challenges
The main challenge has been getting a good zoom feel. For me, zoom feels bad when:
- The framerate drops because the browser can’t handle rendering that many points.
- The zoom behavior is too fast, or jerky.
The solution to #1 is to use three.js. The solution to #2 (so far) is to use D3.js’s zoom behavior combined with three.js. More detail on both below.
Rendering strategies
There are three strategies I considered for visualizing a bunch of points on the web:
- D3.js rendering to SVG
- D3.js rendering to canvas (better performance)
- Three.js rendering to canvas with webGL (best performance when rendering lots of points)
Most D3 examples use SVG, but there are canvas examples for when you are animating lots of points and need the boosted performance. I didn’t find any three.js-specific examples so I made my own. I’d love to see an exhaustive investigation and benchmark for the performance of each (and alternative methods!), but I’m not going to do that here.
Prior art and past experience
I’d had my own experience with the limits of SVG rendering for lots of points. I’d also seen a bit of what WebGL could do while working on our Probabilistic Real Estate prototype, which uses Mapbox’s WebGL library. For knowledge of canvas and three.js strategies, I was lucky to have the examples of two great past projects from FFL interns.
- Aditya used D3 rendered to canvas in his visualization of a community’s taste in movies. I watched him push canvas rendering to its limits, rendering around 20,000 points.
- Sepand used three.js to render his visualization of Wikipedia articles. He was able to render 100,000 points without framerate issues. Coming (like me) from D3 experience, he had to invest considerable dev time in understanding three.js’s camera system.
Based on those experiences, I went into this project thinking I’d use three.js. It also just seemed like fun. Three.js comes more out of the game dev world than the web app one I’m used to. A lot of recent web app innovation has come from adopting techniques from the video game world, so I was excited about the opportunity to further explore that path.
Getting started in three.js
I looked through the three.js documentation and examples. Then I started looking for examples of 2D visualizations that were similar to what I wanted to create. There are not many. I did find this Stack Overflow post about setting up a 2D view, which had some helpful points for getting started and an encouraging tone (I love that by the third update they’re reading Computer Graphics and Principles).
Setting the scene
I started with the basic scene set-up from the three.js tutorial, and worked on replacing the spinning cube with a wall of points. I put some work into trying to understand the PerspectiveCamera, but in terms of getting things to render at the size I was after I mainly used trial and error of plugging in different parameters. One of the downsides of rendering to a canvas (rather than HTML or SVG) is that you don’t have a DOM to inspect for debugging. Often I’d find myself with a blank canvas and I’d have to retrace my steps to a point where things were working. I made frequent reference to Sepand’s code.
The animation loop
One of the video game techniques you use in three.js is the animation loop:
// Three.js render loop
function animate() {
  requestAnimationFrame(animate);
  renderer.render(scene, camera);
}
animate();
Rather than having logic set up to only re-draw when things change, the animation loop is always re-drawing. Because of this, you don’t have to worry about render logic as you update objects (like the camera) in a three.js scene. You just update them. This resonates with the philosophy of newer javascript frameworks like React. I don’t know the exact paths of influence there (I would be interested to read them!) but it’s fun for me to discover connections as I go.
Z-Fighting
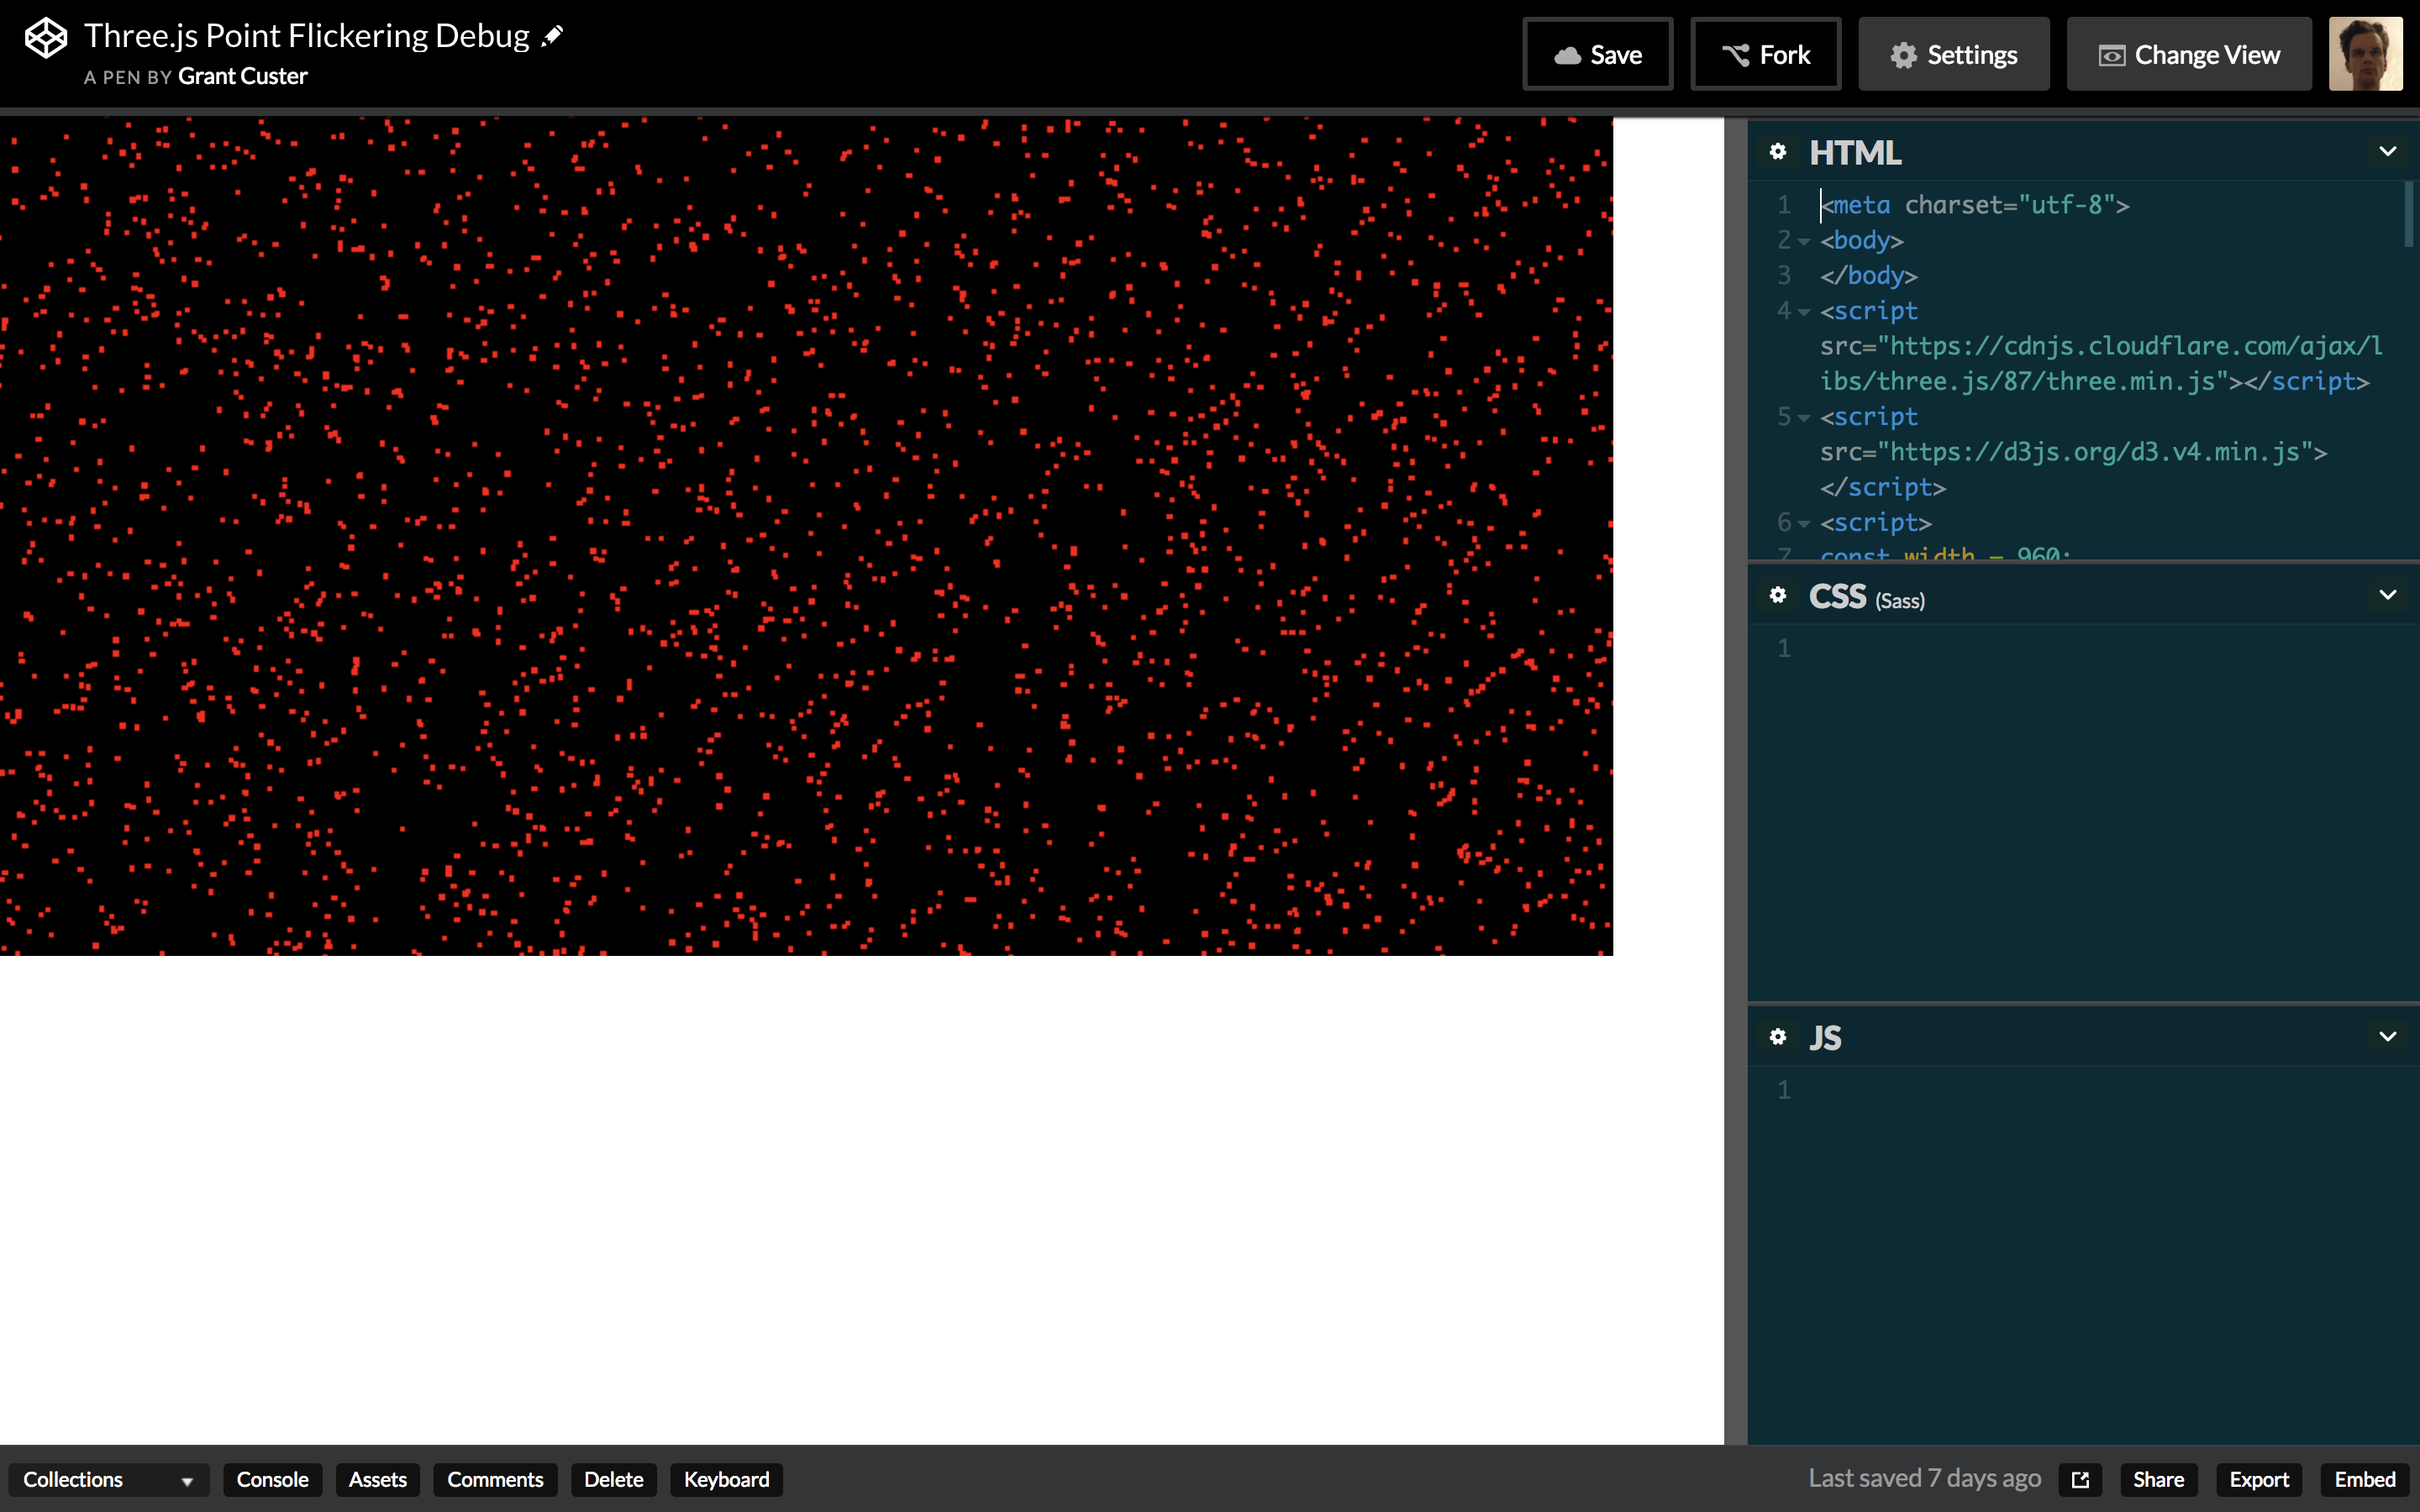
An early challenge: flickering caused by z-fighting
After I got a lot of points to render at the size I wanted, I found that some of the points would flicker. I eventually learned this flickering was caused by z-fighting, where, because they were all on the same z-level, different points were ‘winning’ each time the scene was drawn. It sounds like there is some combination of camera properties that could solve the issue, but I was unable to find the right combo. As pointed out in the above-mentioned Stack Overflow post, you may also be able to fix it by slightly varying the z-value of each point. If it came to it I would do that, but it didn’t feel right.
I ended up solving the problem by setting sizeAttenuation: false on the
PointsMaterial. In its default state of true, sizeAttenuation scales the
points so they appear larger as you get closer and smaller as you move the camera
farther away. Attenuation makes sense as a simulation of real objects, but
for a visualization, setting it to false, which means the points stay the same
size regardless of zoom level, is often more desirable. Unattenuated means that as you zoom in, the negative space between points
expands. For dense visualizations, this lets you see local structure better as
you zoom in. I’m not sure why turning off sizeAttenuation fixed the z-fighting issue, but since I wanted it off anyway, I closed
the case.
Zoom and pan
Getting the points on the screen went fairly smoothly. Dialing in a zoom and pan set-up that I’m happy with was more of a process. Targeted zoom requires an understanding of the camera and perspective that I’m still developing.
Handling mouse events
First I needed to translate mouse events into zoom and pan actions. I started by
trying to plug in D3’s zoom behavior, since I was most familiar with it, and I
didn’t want to do the low-level event work of calculating how far a user
scrolled. The zoom behavior gets you a scale level, and an x and y value.
Combined in a transform, they get you the sort of directed zoom I was after. But I ended up
using only the scale level from it because I could not figure out how to translate
the x and y coordinates into the correct three.js camera
position. I’m 90% sure it’s doable, but I didn’t figure it out this round.
Directed zoom
I had a hard time finding an example of the zoom behavior I wanted implemented in three.js. Even Google’s impressive Embedding Projector zooms to the center of the screen rather than following the mouse position. I thought that if I could figure out how to translate the mouse position on screen along different z-values, I could figure something out myself. That question turns out to be a relatively well-explored one because people often need it to calculate hover interactions with objects.
This code snippet from WestLangley turned out to be the key for getting directed zoom working:
var vector = new THREE.Vector3();

vector.set(
    ( event.clientX / window.innerWidth ) * 2 - 1,
    - ( event.clientY / window.innerHeight ) * 2 + 1,
    0.5 );

vector.unproject( camera );

var dir = vector.sub( camera.position ).normalize();

var distance = - camera.position.z / dir.z;

var pos = camera.position.clone().add( dir.multiplyScalar( distance ) );
It projects a ray from the camera through the mouse position. You can then
move along that ray on the z-axis, using the z value to get back new x and
y coordinates. In my code, I’m taking the scale from D3’s zoom behavior and
plugging it in as the new z value. I can then use the x and y values to set the
new camera position and get the directed zoom effect I was after. My
understanding of exactly what’s happening here is still fuzzy, I tried
dissecting it a bit and hope to do more in the future. For now, though, it
works.
Crashing
I crashed my browser a lot during the zoom experiments, and sometimes even crashed my
computer especially when I started trying to console.log to debug on zoom
events. I don’t have any real insight into what was causing the crash. I tried
some developer tools profiling, but I wasn’t really sure what to look for. Compared
to an error message, a crash is a real bummer to recover from, and it’s a big
reason I didn’t dissect the zoom code further. The cost of a mistake was too
high. This was compounded because I don’t really have a sense yet of what is
expensive for three.js/3D in general and what is not. I kept stumbling into
crashes while changing something I thought was innocuous. The whole experience made me less
likely to experiment with changing things that were working, which is a big part
of how I learn how things work. I don’t know if there’s anything to be done at a
library or browser level that would result in more error messages and fewer
crashes, but it would be a big help for getting started.
Panning
While looking for a panning solution, I found Andrei Kashcha’s three.map.control, which conceptually had the things I was after for both directed zoom and panning. I did not like the zoom feel, however. In my opinion it moves too fast and the thresholding makes it jerky. The momentum setting on the panning is also not what I was after.
I checked out the code, and found the getCurrentScale
function which calculates the current scale based on the camera settings and z
value. Using this along with the movementX and movementY events from D3’s
zoom behavior (how
far you’d dragged) yielded the pan behavior I was after.
I experimented with using getCurrentScale to replace the ray function I was using for zoom.
It seemed cleaner to have the directed zoom and panning operating off the same
logic. After a fair amount of experimenting I got values fairly close to the ray
method – but not close enough. It felt like I was zooming on ice. I’m
still 90% sure can be done, but after crashing the browser a bunch
of times trying to figure it out, I decided to stick with the current working
configuration.
A practical success
So, after lots of experimentation, crashes, and help from other people’s code, I made it to a working example with tens of thousands of points, and the zoom and panning behavior I was after. I’d like to tighten up the code for that behavior as well as my understanding of it, but that’s always the case. I’ve had my first tangle with a lot of the concepts and edges of three.js, and I expect I’ll have lots of opportunities to revisit them. I look forward to learning how to do all of this stuff better in the future.
Notes
- In the current demo the zoom direction is inverted because I’m plugging D3’s scale directly into the camera’s z-value. D3 evidently has some easing as you zoom in close, where it slows down the rate of zoom change. That means I can’t just simply invert the scale. I’ll figure out something to fix this in the future.
- In the demo, I scale the point size up a bit when you’re really close. This is what feels best to me – points stay the same size most of the way in, but at the end they get a bit bigger. Right now it’s all an experiment in what feels right.
- Why exactly is three.js fast? This is something I’d love to learn more about. My operating understanding is that WebGL uses the GPU, which is good at doing these kinds of calculations, and three.js is also very smart about only drawing what you can currently see (known as culling). I don’t know how this all plays out though. Is it fast mostly because of the GPU use or mostly because of the culling?
- The camera uses a field of view setting which is not at all intuitive to me, but if you have friends or coworkers who are into actual physical cameras they’ll have a bunch of experience with it. You can ask them about it and they’ll probably draw diagrams.
- Why am I using a 3D library for a 2D visualization? Because it’s fast. I did look at the 2D WebGL renderer PixiJS but found mostly game related examples. I could also try using the WebGL library directly. I’d love to read about either of those approaches. But given my time limit three.js seemed the right level at which to dive in.
- Why are the points squares? It is apparently more taxing to draw circles. Sepand did it, and I plan to eventually (with sprites) once I understand the ins-and-outs a little more.