Mar 22, 2017 · talk slides
Taking Prophet for a Spin
Facebook recently released Prophet, a general purpose time series forecasting package with both Python and R interfaces.
Python and R already have plenty of time series forecasting options, so why is Prophet interesting? It caught our eye because the backend is implemented in Stan, a probabilistic programming language we researched in our most recent report.
This choice means that Prophet offers many of the advantages of the Bayesian approach. In particular, the models have a simple, interpretable structure (seasonality) on which prior analyst knowledge can be imposed, and forecasts include confidence intervals derived from the full posterior distribution, which means they offer a data-driven estimate of risk.
But by keeping the probabilistic programming language in the backend, the choice of Stan becomes an implementation detail to the user, who is probably a data analyst with a time series modeling problem. This user can continue to work entirely in a general purpose language they already know.
In this post, we take Prophet for a spin, exploring its user interface and performance with a couple of datasets.
The model
Prophet implements a general purpose time series model suitable for the kind of data seen at Facebook. It offers piecewise trends, multiple seasonality (day of week, day of year, etc.), and floating holidays.
Prophet frames the time series forecasting problem as a curve-fitting exercise. The dependent variable is a sum of three components: growth, periodic seasonality, and holidays.
Prophet models nonlinear growth using a logistic growth model with a time-varying carrying capacity. It models linear growth using a simple piecewise constant function. Changepoints (where growth rate is allowed to change) are modeled using a vector of rate adjustments, each corresponding to a specific point in time. The rate adjustment variable is modeled using a Laplace distribution with location parameter of 0. Analysts can specify changepoints by providing specific dates or by adjusting the scale parameter associated with the Laplace distribution.
Prophet models periodic seasonality using a standard Fourier series. For yearly and weekly seasonality, the number of approximation terms is 20 and 6 respectively. The seasonal component is smoothed with a normal prior.
Finally, holidays are modeled using an indicator function. The indicator function takes 1 on holidays and is multiplied by a normal smoothing prior.
For both seasonal and holiday priors, analysts can adjust the spread parameter to model how much of the historical seasonal variation is expected in the future.
Using Prophet
The model is specified in a short Stan listing that gets compiled behind the scenes when the Prophet is first installed. The user need never touch the Stan code, and works with Prophet entirely through its Python or R interfaces.
To demonstrate these interfaces, let’s run Prophet on an infamous dataset with extremely strong seasonality: atmospheric carbon dioxide as measured on the Hawaiian volcano of Mauna Loa.
Having prepared a pandas DataFrame maunaloa, running Prophet is just a couple
of lines:
m = Prophet()
m.fit(maunaloa)
future = m.make_future_dataframe(periods=120, freq='m')
forecast = m.predict(future)
This code takes a couple of seconds to run and yields the following forecast:
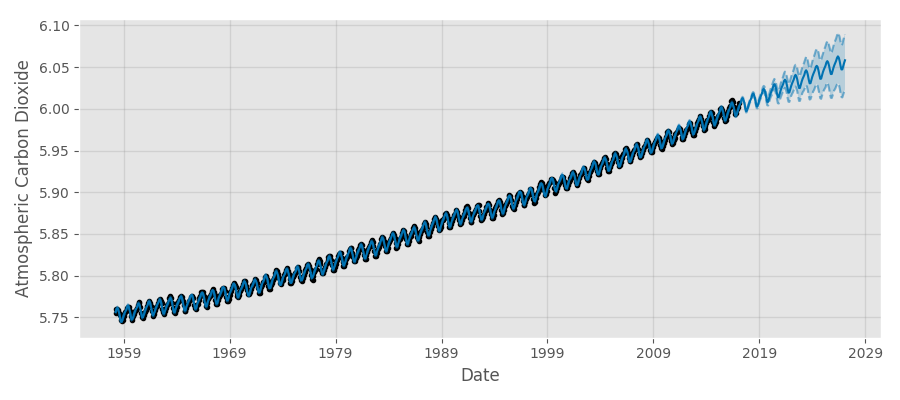
Prophet’s simple model is easily able to detect the strong annual periodicity and long-term upwards trend. Note that the forecast comes with data-driven confidence intervals for free, a crucial advantage of probabilistic programming systems.
Prophet also yields simple, interpretable results for the components (date, day of week, day of year) of the time series decomposition.
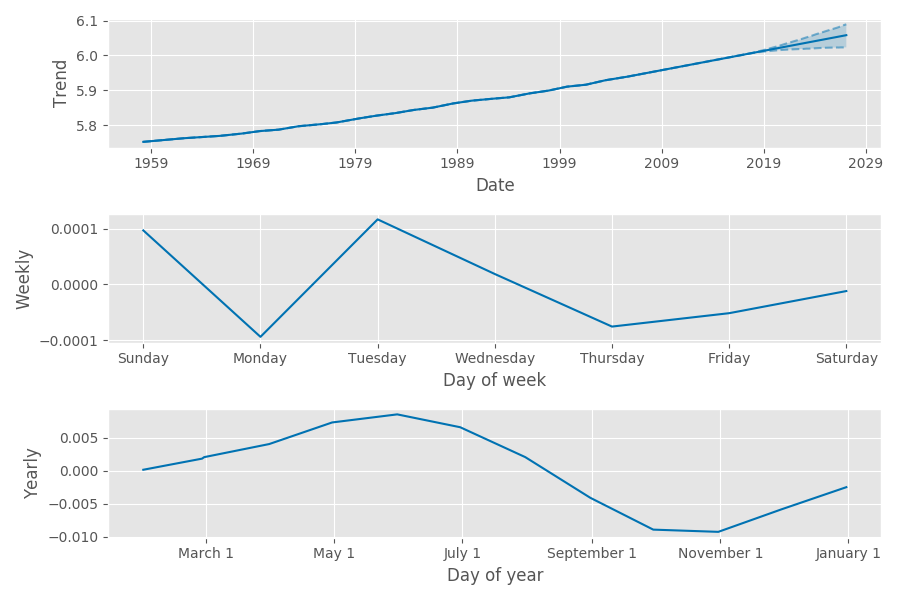
Notice the weekly component is much smaller than the other two, and likely mostly noise. This makes sense; global atmospheric chemistry doesn’t vary by day of the week! On the other hand, the yearly component shows the seasonal impact of northern hemisphere vegetation levels on carbon dioxide levels; the levels are higher lower after the summer and higher after winter.
Birth data
Let’s now run Prophet on a more challenging dataset, the number of births in the United States by day of the year. This dataset was analyzed using Gaussian Processes and made famous through its appearance on the cover of Bayesian Data Analysis, Andrew Gelman’s textbook. It’s a dataset with seasonality (both yearly and weekly) and holiday effects.
m = Prophet(changepoint_prior_scale=0.1)
m.fit(birthdates);
future = m.make_future_dataframe(periods=365)
forecast = m.predict(future)
Here we demonstrate Prophet’s ability to automatically detect changepoints by adjusting the changepoint smoothing parameter. Instead of the default value of 0.05, we set the changepoint smoothing parameter to be 0.1. This makes the resulting forecast more flexible and less smooth, but also more susceptible for chasing noise. If we were doing this for real we would of course conduct a formal cross-validation to empirically determine the proper value of this hyperparameter.
Prophet takes about a minute to run on this dataset (black points) and gives the following forecast (blue line). We show here a truncated time series from 1987 to 1990.
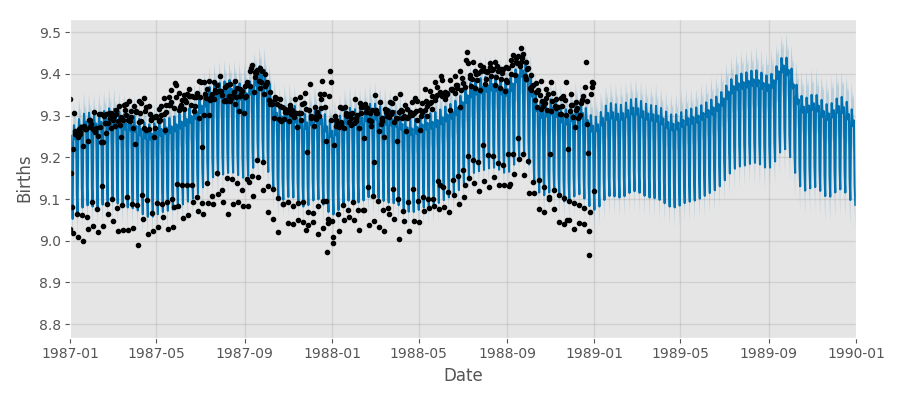
We can see the origin of the almost bimodal distribution of the data in the component plots. Prophet finds the strong weekday/weekend variation. We also see the yearly seasonality effects: more births around August to October.
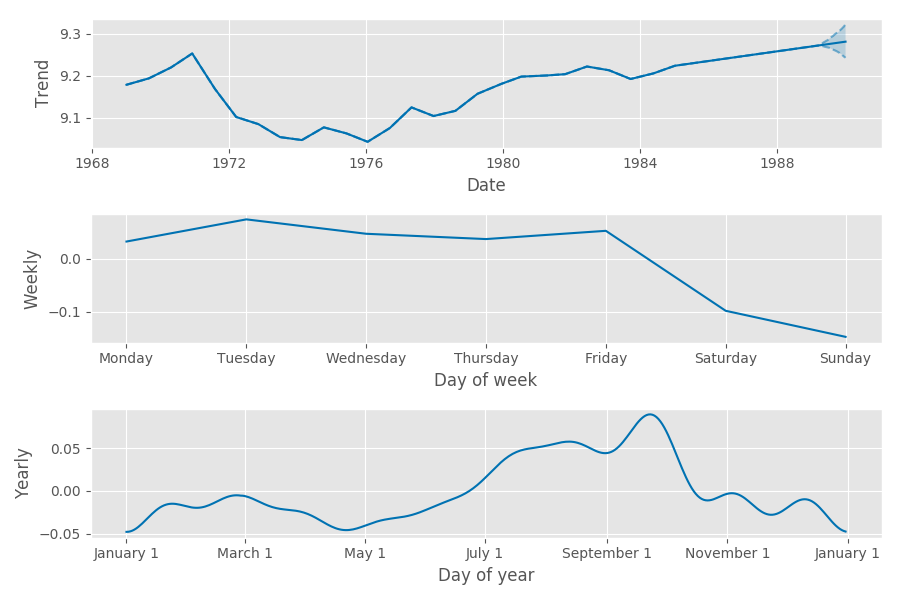
These components are very similar to the those found using Gaussian Processes. That analysis finds spikes in the number of births on specific days during the year. For example, the number of birth is anomalously low on New Year’s day and high on Valentine’s Day. We stopped short of doing this, but these special days could be captured in Prophet as “holidays” by defining a indicator variable series that says whether each date covered by the dataset and forecast was/will be a holiday.
Advantages of Prophet
In our probabilistic programming report we emphasized that the Bayesian approach, made simpler by probabilistic languages like Stan and pymc3, allows developers and statisticians to quantify the probability of all outcomes and not just determine the most likely prediction. The prior and interpretability make the models more practical.
Prophet makes these advantages concrete for a specific use case: forecasting. It makes sensible choices for a general purpose time series modeling function. Some flexibility is sacrificed in the modeling choices, but the trade-off is a great one from the point of view of the intended typical Prophet user. It abstracts away the complexity of working with Stan’s powerful but somewhat eccentric interfaces behind idiomatic Python and R APIs, which makes the system even easier and quicker for data scientists and analysts to use. Prophet is a great example of a robust, user-friendly probabilistic programming product.


