Aug 8, 2017 · post
Encartopedia
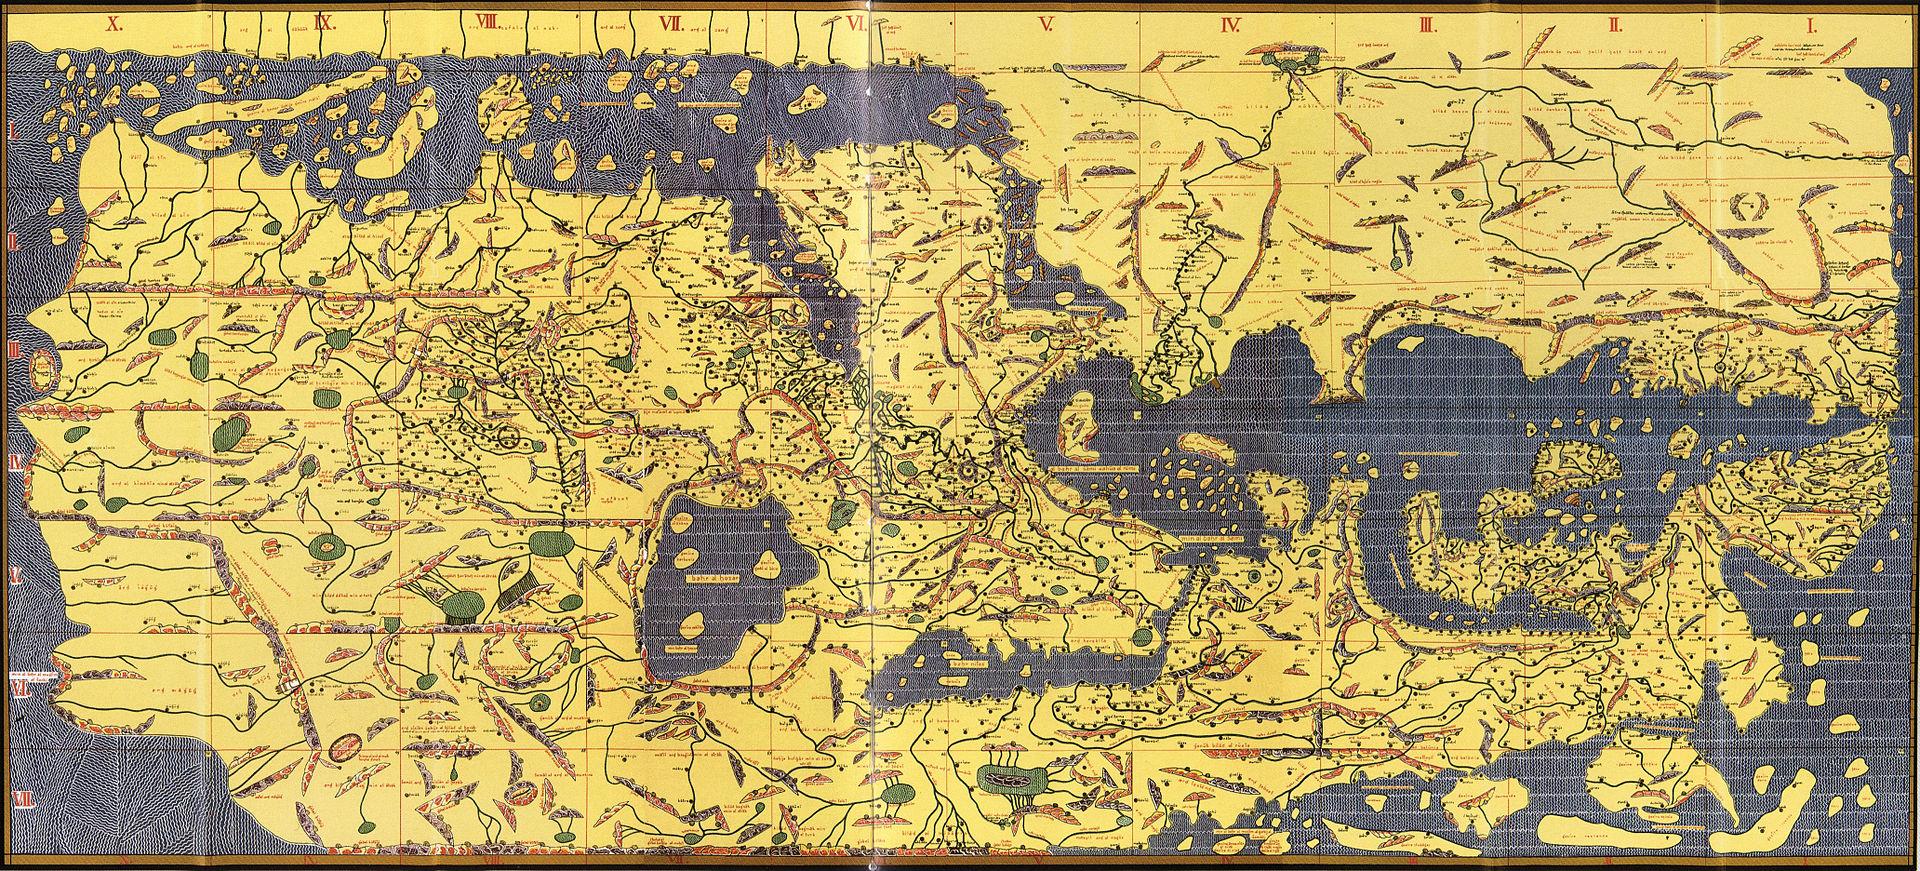
The Tabula Rogeriana, a world map created by Muhammad al-Idrisi through traveler interviews in 1154.
The Wikipedia corpus is one of the favorite datasets of the machine learning community. It is often used for experimenting, benchmarking and providing how-to examples. These experiments are generally presented separate from the Wikipedia user interface, however, which has remained true to the early hypertext vision of the web. For this experiment, Encartopedia, I used machine learning techniques and visualization to explore new navigation possibilities for Wikipedia while preserving its hypertextual feel. With Encartopedia, you can map the path of any journey through Wikipedia, or use the visualization to jump to articles near and far.
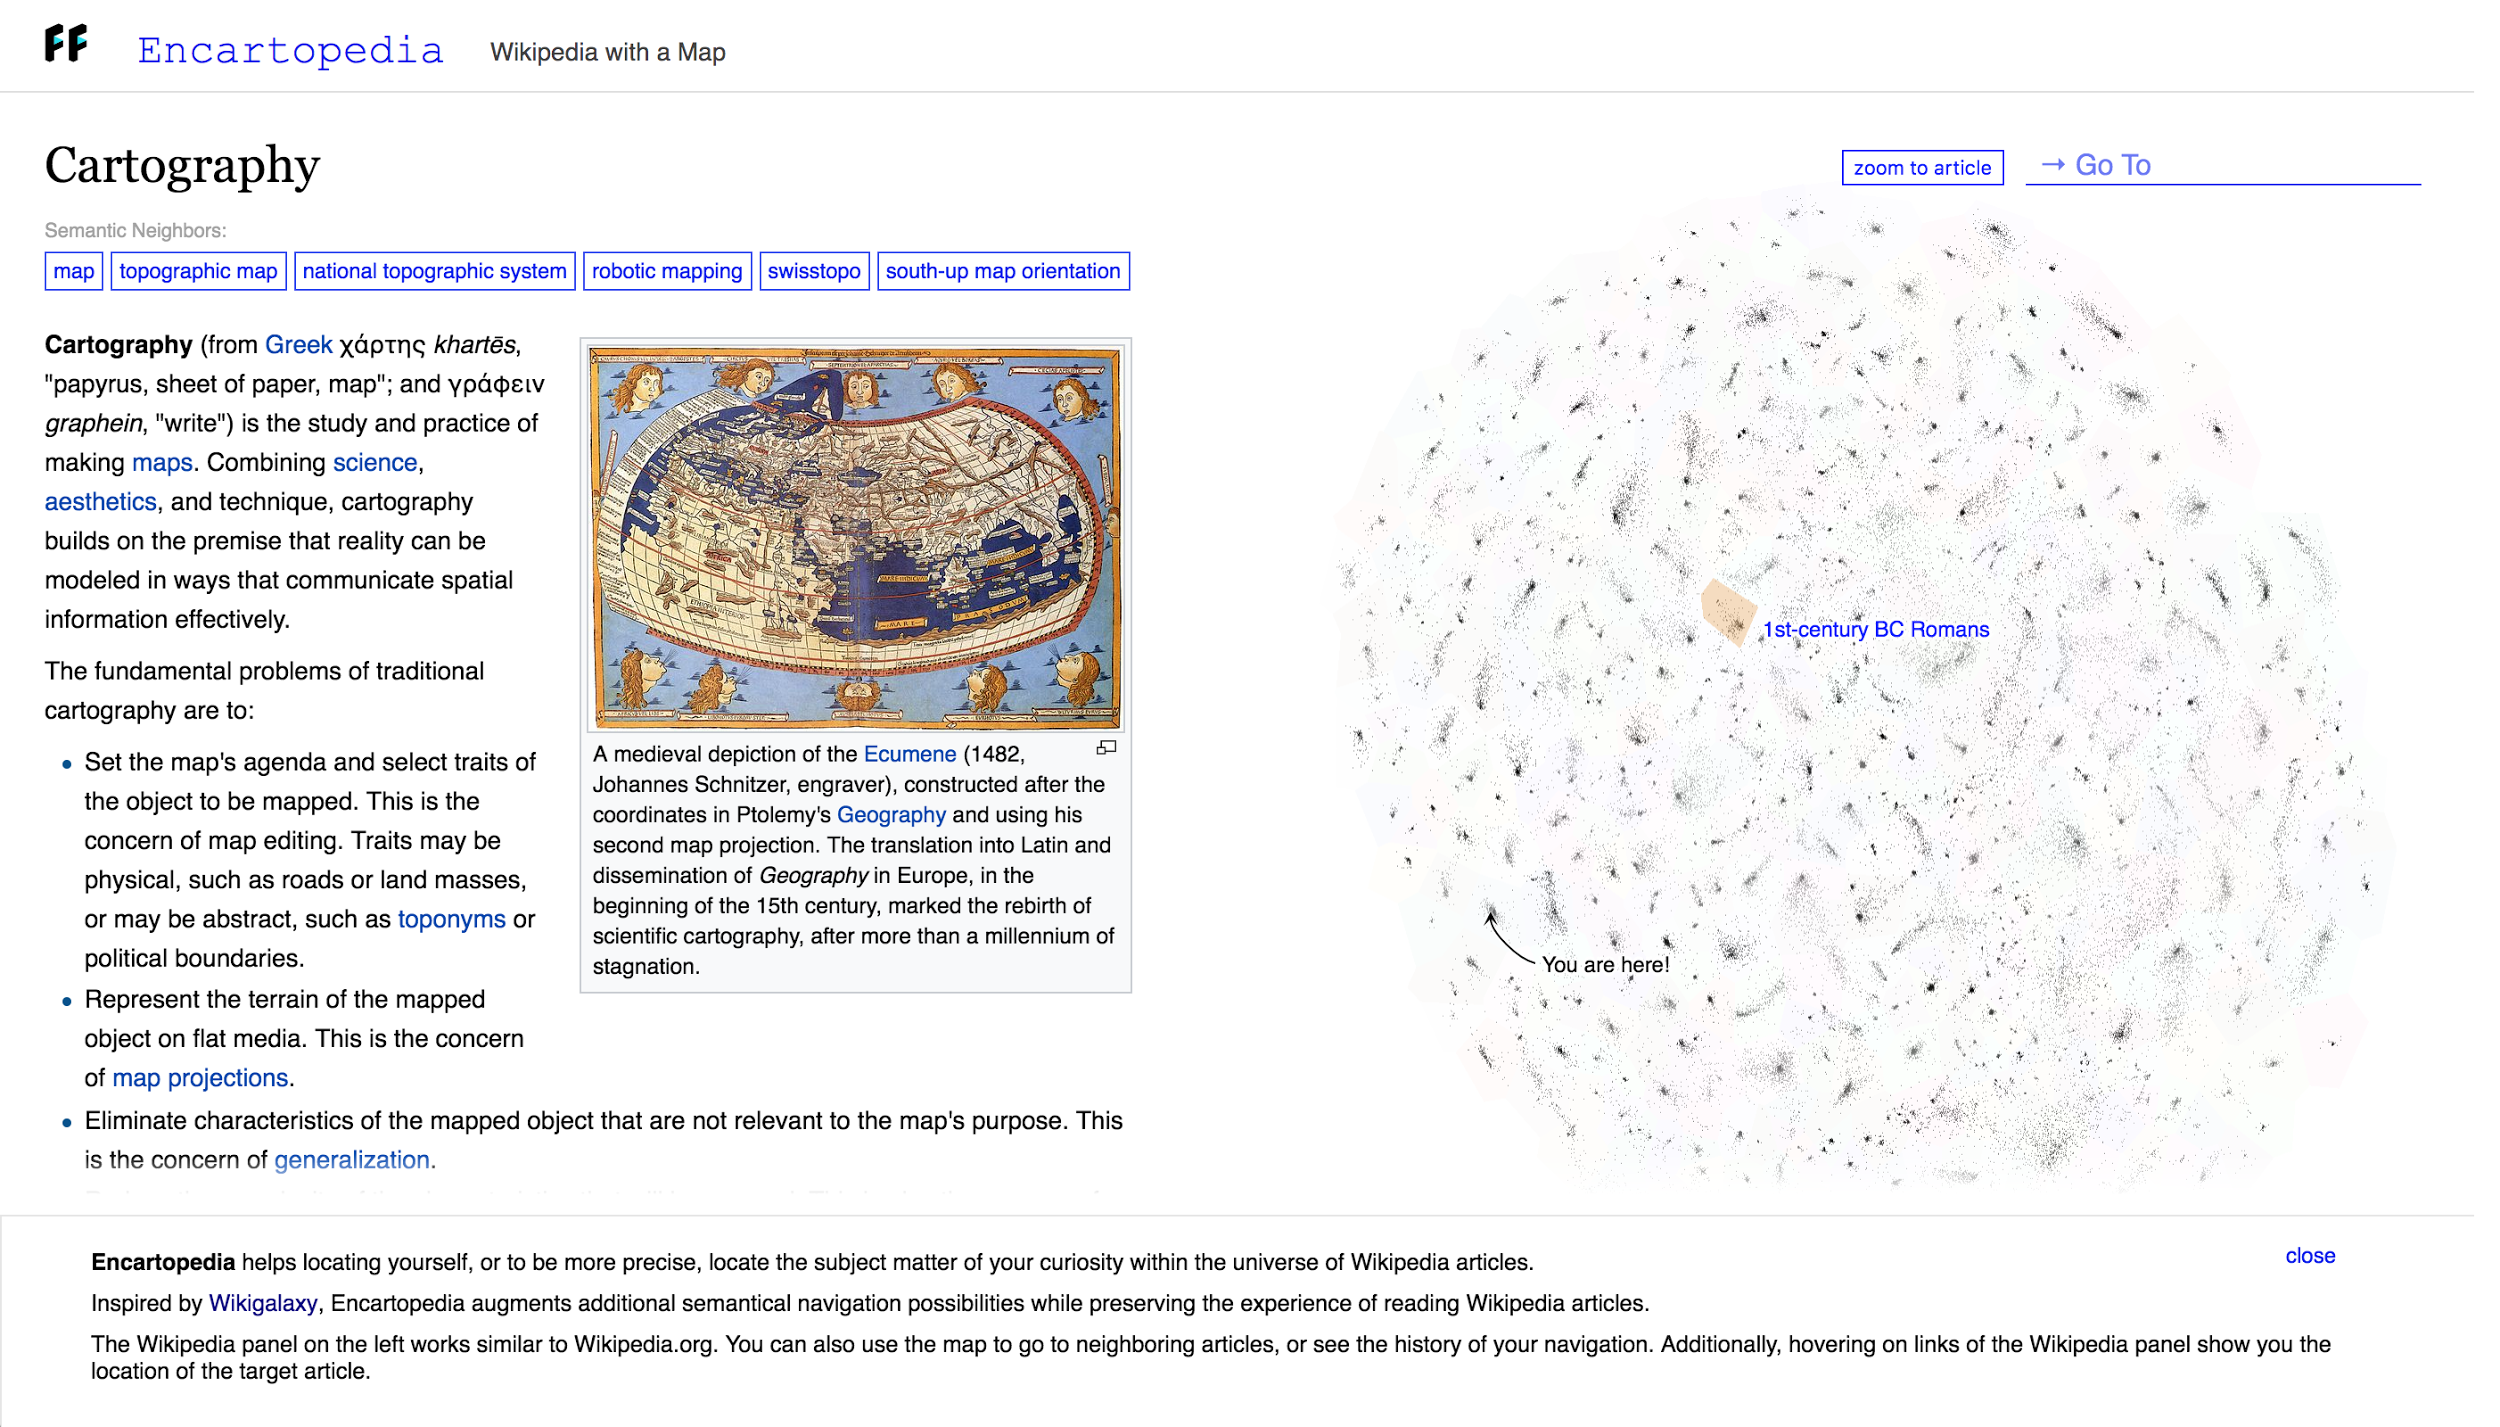
Encartopedia features the conventional Wikipedia interface in the left panel, and a mapping of articles based on similarity on the right.
Mapping articles
The starting point for the research was hatnote.com which has a glossary of Wikipedia visualizations and alternative user interfaces. Among those examples Wikigalaxy by Owen Cornec was the most inspiring for its attempt to map the semantic space of Wikipedia into a navigable space. From Wikigalaxy I borrowed the coordinates of their dimensionality reduction algorithm, mapping the articles to 2D coordinates for the 100,000 top Wikipedia articles.
The mapping of the top 100,000 articles makes up the base visualization in the right-hand panel of Encartopedia. The mapping is not only limited to those 100,000 articles, however. Any article you navigate to in Wikipedia can be located on the navigation map. To make this possible I used a method similar to this benchmark to create a fast index of 500 dimensional LSA vectors for all five million articles. I used Annoy to query the nearest neighbors of the chosen article and used triangulation to then place the article on the map. The nearest neighbors are also displayed above the Wikipedia article in the “Semantic Neighbors” section.
Categorizing clusters
In order to color code and categorize the topic clusters in the article map, I applied the DBSCAN clustering algorithm over the result of article coordinates. Unlike many other clustering algorithms DBSCAN doesn’t create evenly sized clusters, making it a good fit for the map clusters (after some parameter tuning). DBSCAN doesn’t assign categories to all the points but it is easy to assign those points to a cluster in the second pass using Nearest Neighbors. To name the clusters I scraped the Wikipedia categories assigned to those articles and found the top category shared between them.
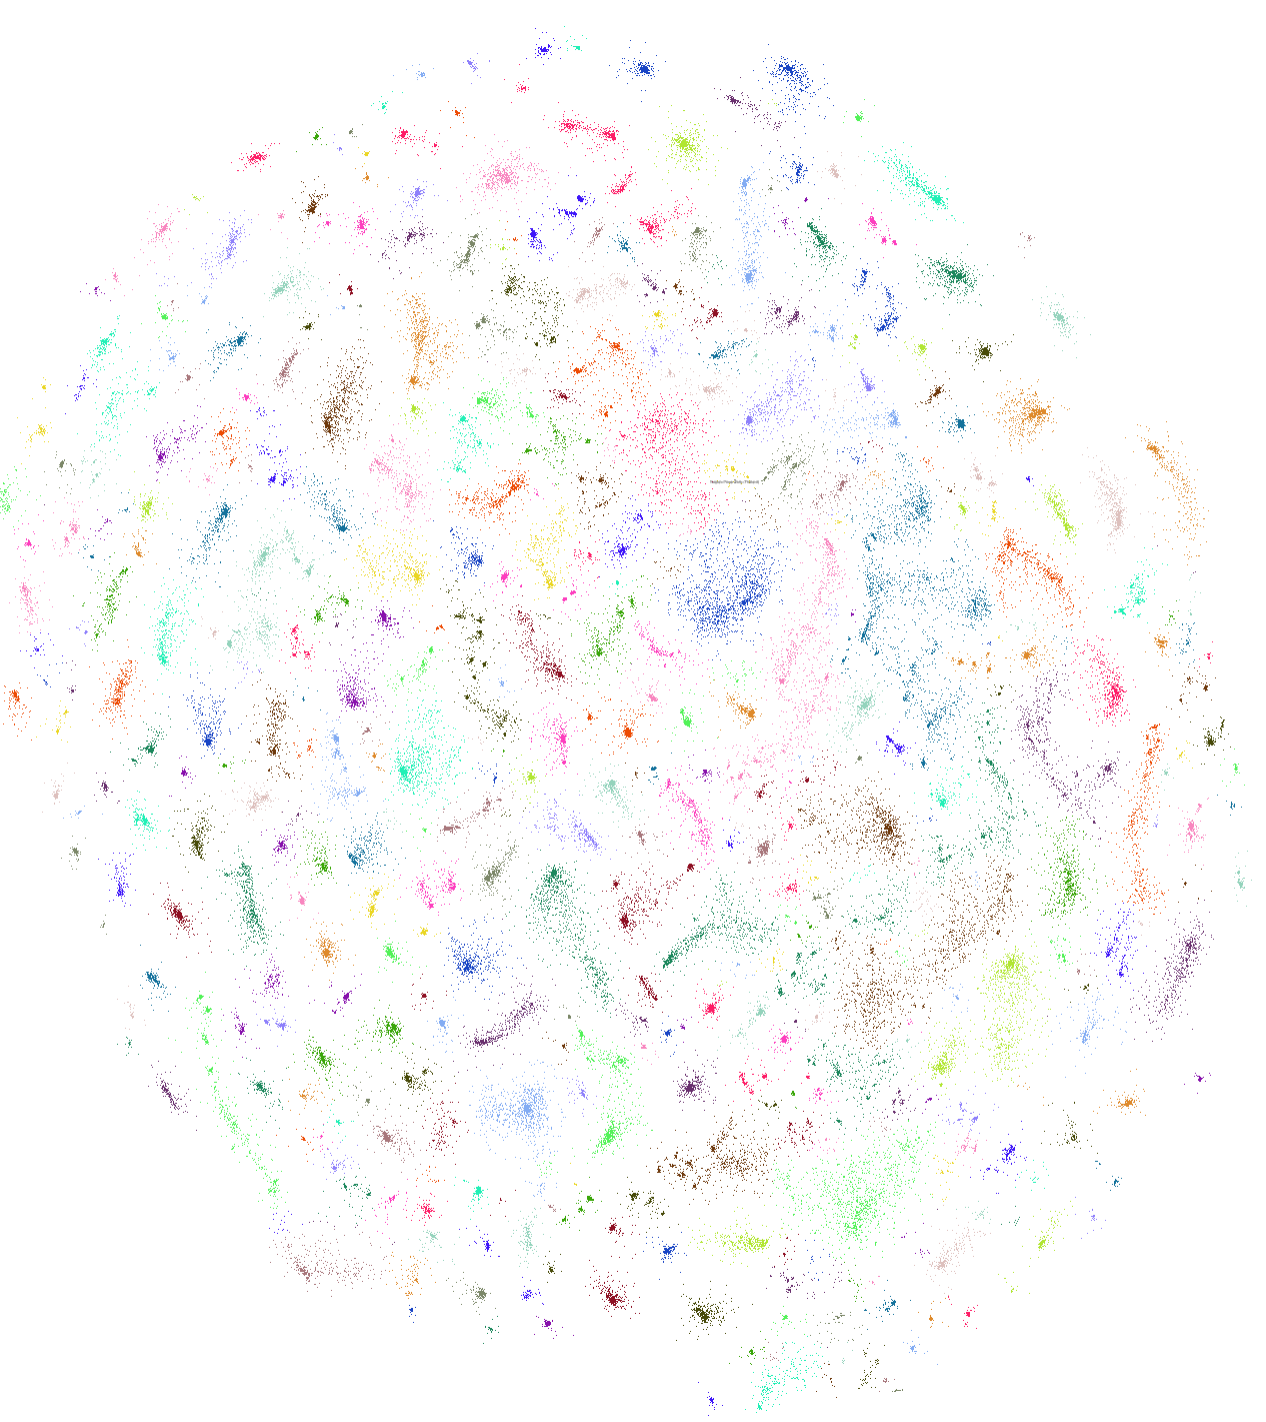
Color coding points by clustering using DBSCAN
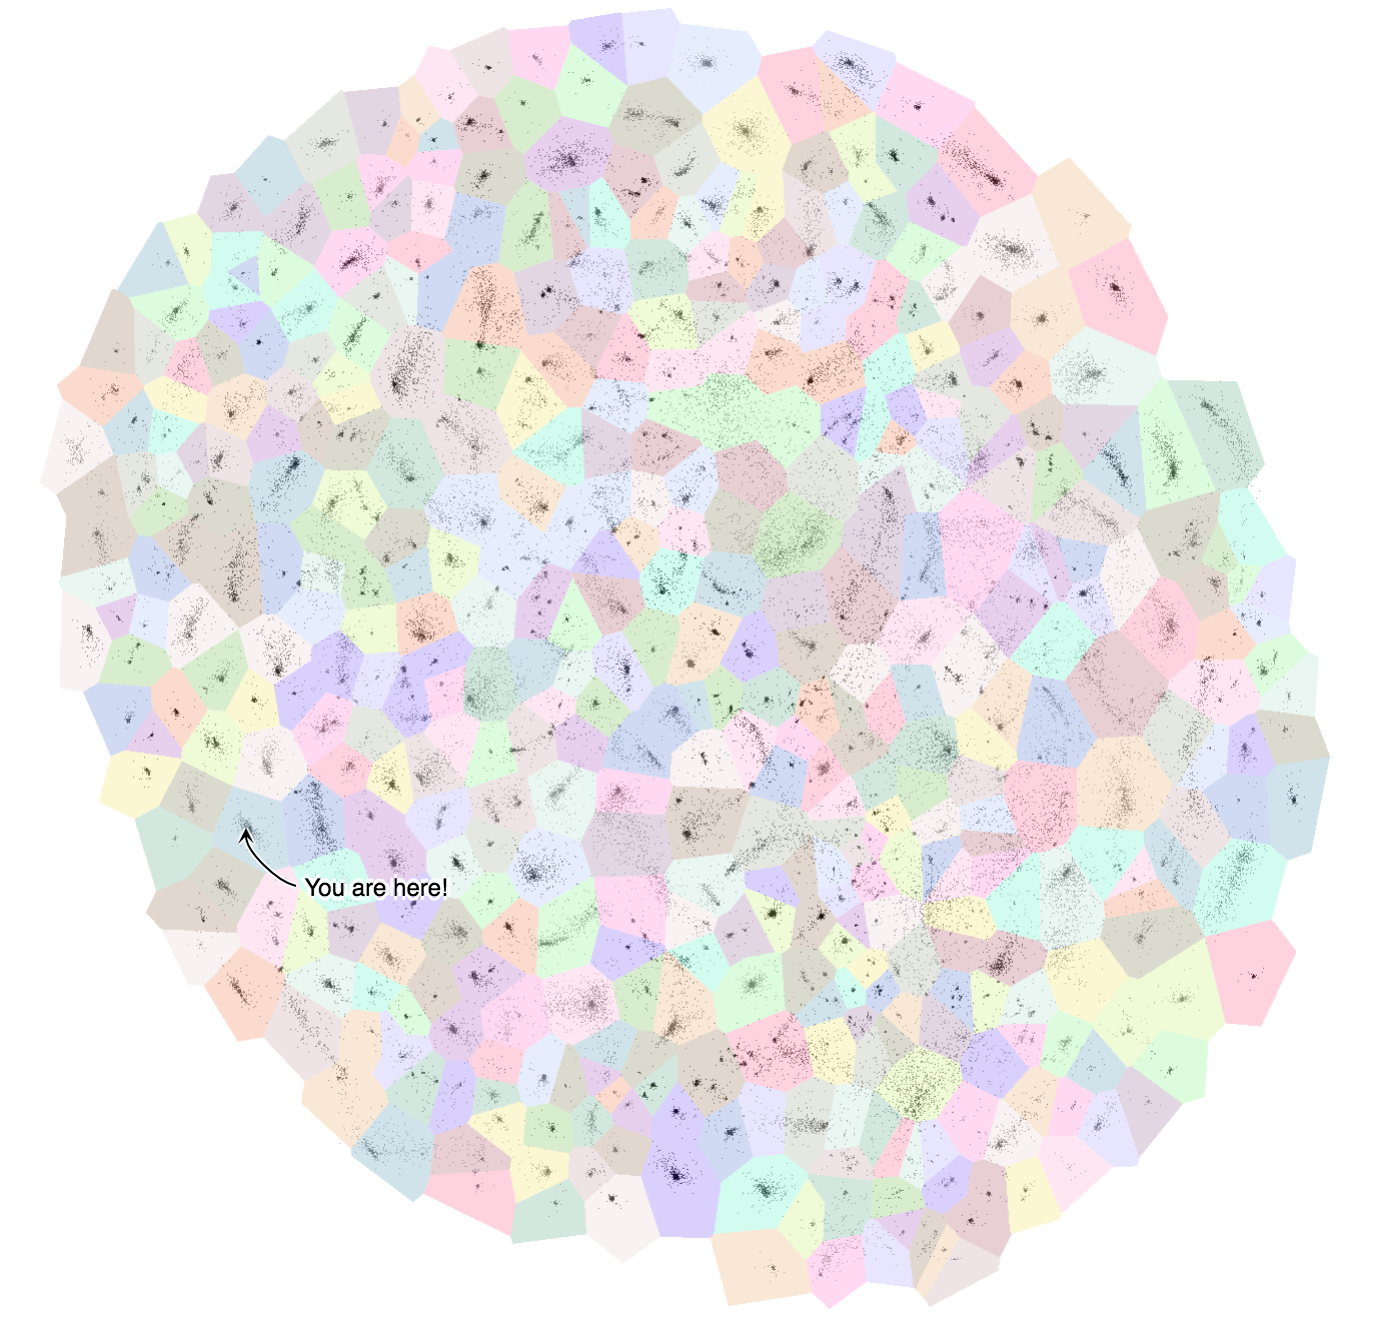
Overlaying the clusters with a voronoi diagram for mouseover interactions.
Making it interactive
The UI is build using React and Redux. The map is mostly in three.js and rendered on a canvas except for the annotations which are SVG. Using D3.js is almost inevitable in any data-driven UI, especially with the modular design of version 4, however the DOM manipulation is done only with React.
The possibilities of encyclopedia cartography
My interest in Wikipedia is not just because I spend too much time reading random articles, but also because I am fascinated by the idea of the ultimate encyclopedia containing the totality of human knowledge. Once such an encyclopedia was an idealistic dream that was mostly fantasized about in literature, but now its accessibility has trivialized it to the point it no longer has its past allure. So maybe being able to map and log the navigation within this meta-space brings back a little bit of the old fantasy.
On the other hand hyperlinks are no longer the unique source of signifying the relation between two nodes on the web. The hypertext web is declining where social media indexes play a more important role in determining how much media objects on the web are valuable and related. Wikipedia is unique for remaining purely hypertextual. Encartopedia is also a celebration of the good old hypertextual web.
In the end I wanted to mention how grateful I am for Fast Forward Labs, especially Grant and Hilary for giving me the opportunity to work on this project which I have been fascinated with for a long time. I would also like to thank Micha for help with figuring out ML challenges and Raschin for help with UI, hatnote and Owen Cornec for inspiration and all the creators and contributors to the open-source projects I have used.
– Sepand

