May 27, 2021 · post
Pretrained Models as a Strong Baseline for Automatic Signature Verification
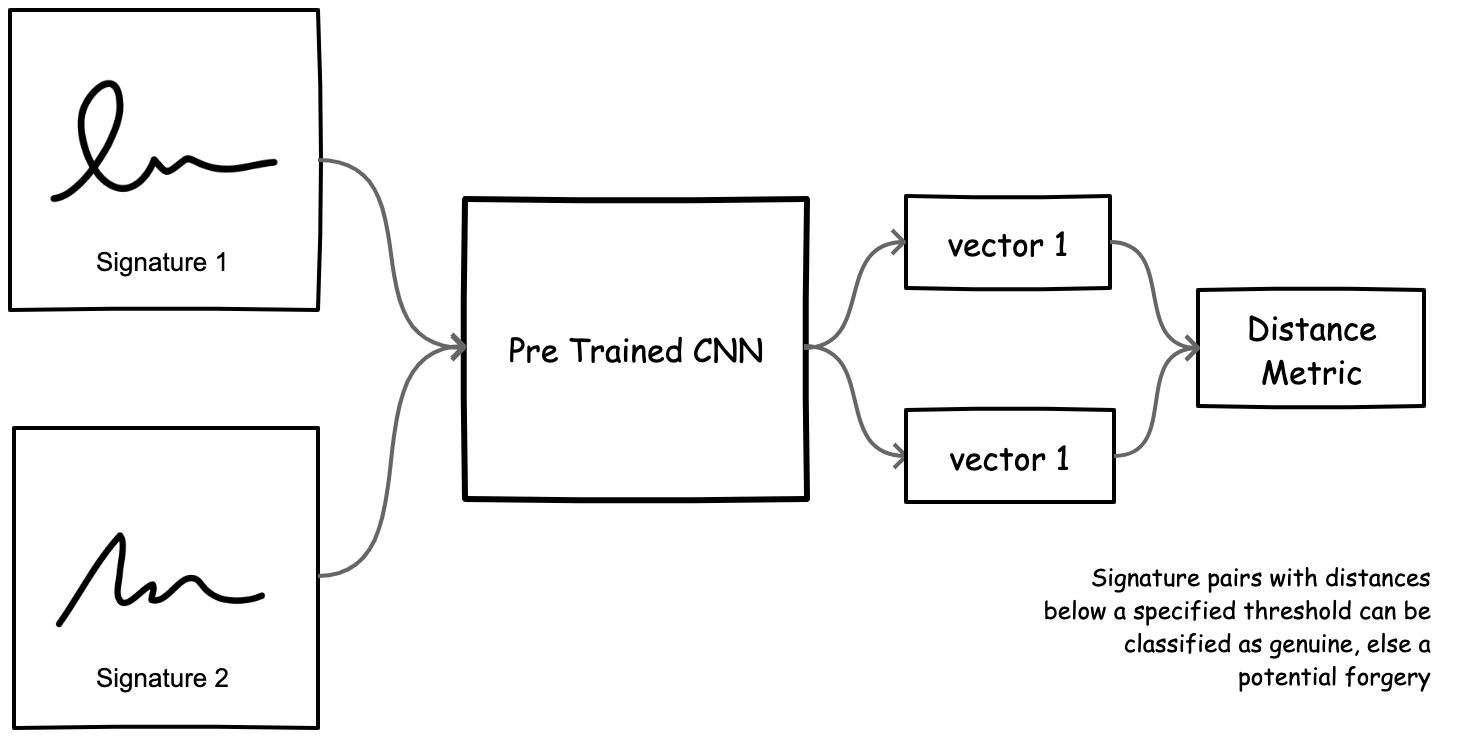
Figure 1. Baseline approach for automatic signature verification using pretrained models
As discussed in our introductory blog post, offline signature verification is a biometric verification task that aims to discriminate between genuine and forged samples of handwritten signatures. This is a particularly important form of verification due to the ubiquitous use of handwritten signatures as a means of personal identification in legal contracts, administrative forms, and financial documents. Due to the significance and scale of this task, signature verification has become a critical line of research in the field of machine learning and pattern recognition, as a way to reduce the uncertainty and inefficiency involved in the manual authentication process. 1
In this series of work, we frame signature verification as a representation learning problem, where we ultimately learn a model that yields semantically meaningful representations of signatures such that vectors for similar signatures are close and dissimilar signatures (likely forgeries) are far apart, using some distance metric. However, before structuring the task as a learning problem, it’s useful to first develop a simplistic baseline upon which we can compare future system performance.
In this post, we’ll explore how pretrained convolutional neural networks (CNNs) can be applied directly to the signature verification task and use them to establish performance baselines. Specifically, we will:
- Introduce a public dataset for the signature verification task (the CEDAR dataset and discuss a few preprocessing steps required to remove biases in the data
- Present an approach to the task of automatic signature verification that uses a pretrained CNN backbone to extract feature representations from images of signatures
- Compute a distance metric between a pair of extracted feature representations and apply a threshold on that distance to classify the image pair as genuine (small distance) or forged (large distance)
- Introduce a set of evaluation metrics that enable us to compare the performance of multiple models
- Explore how choices in the layer used for feature extraction (early versus later layers) affect system performance across several model architectures
By the end of this post, we’ll develop general intuition about the data and problem space that will help inform future machine learning-based methods. Let’s get started!
The CEDAR Dataset
While a large amount of research in the domain of automated signature verification is conducted with private datasets (making it difficult to characterize performance and compare related work), there are several publicly available datasets that we can experiment with. 2 For our use case, we will make use of the Center of Excellence for Document Analysis and Recognition (CEDAR) Signature Verification Database.
The CEDAR database is composed of 55 signers belonging to various cultural and professional backgrounds. Each of the signers authored 24 genuine signatures, 20 minutes apart. A group of forgers then attempted to emulate the signatures of three authors, eight times each, to produce 24 forged samples for each of the genuine signers. Therefore, the database consists of 1320 genuine and 1320 forged signatures, available as grayscale images. 1
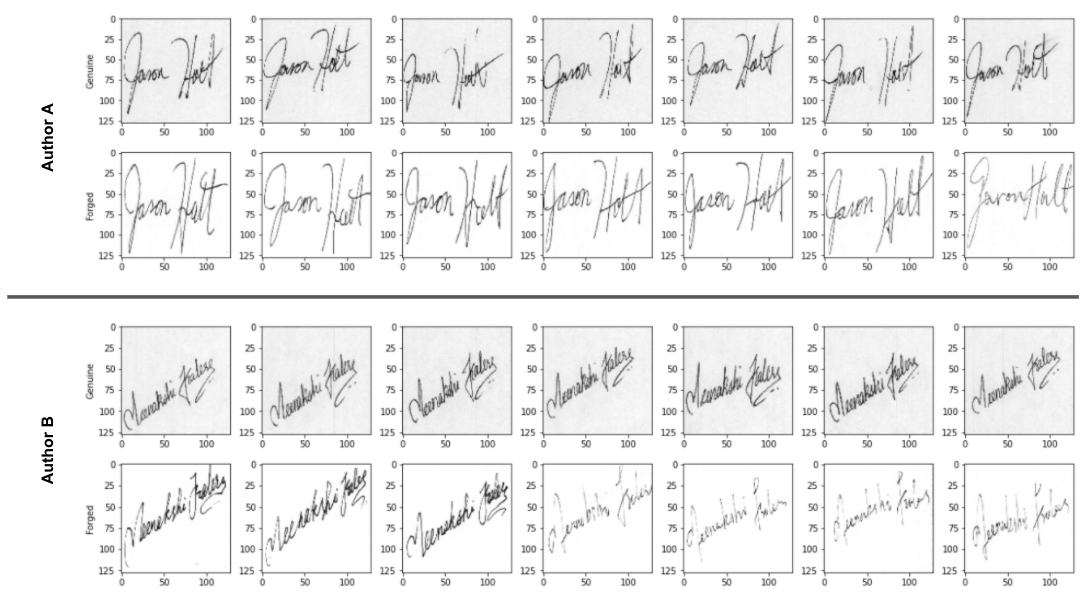
Figure 2. Sample of seven genuine and seven forged signatures for two separate authors from CEDAR signature database
Upon visual inspection of a sample from the CEDAR dataset, we can elicit a few useful insights. First, we see that there is indeed relatively low intra-class variance, but high inter-class variance - meaning signatures from a given author appear similar regardless of whether they are forged or genuine. On the other hand, signatures from different authors are substantially different in style, shape, size, and composition. This makes sense.
Second, we notice that signatures from the genuine class appear to have a distinctly darker background shading than those of the forged class. This distinguishing factor would likely enable any CNN-based feature extractor to naively discriminate between classes based on this unintended data quality issue, rather than the salient features of the signature itself.
![]()
Figure 3. Mean pixel intensity of raw, grayscale CEDAR signatures separated by genuine and forged classes
By plotting the mean pixel intensity of each image in the dataset and coloring by class, we confirm our understanding. Using the CEDAR signatures samples in their current form, we could obtain a genuine/forged classifier with >90% accuracy simply by thresholding the mean pixel intensity at 243. Clearly, this is not a valid nor generalizable practice, so we need to first de-bias the dataset before it can be used to accurately characterize performance with our baseline approach.
Signature Extraction with Image Thresholding
There are several possible methods for extracting a signature from its background context, ranging from simple image thresholding to more advanced image segmentation approaches. Luckily, the CEDAR images contain relatively clean backgrounds, so an image thresholding technique should work well.
Image thresholding, also known as binarization, is the process of separating an image into two classes of pixels (e.g., foreground and background) to eliminate noise by applying a threshold on each pixel in the image. 3 The resulting image is composed of pixels with values of 0 or 1. There are many techniques for determining what the optimal cutoff threshold should be, but here we have chosen Otsu’s Method - a histogram-based technique that identifies a global intensity threshold for a given image (independent of other images in the collection).
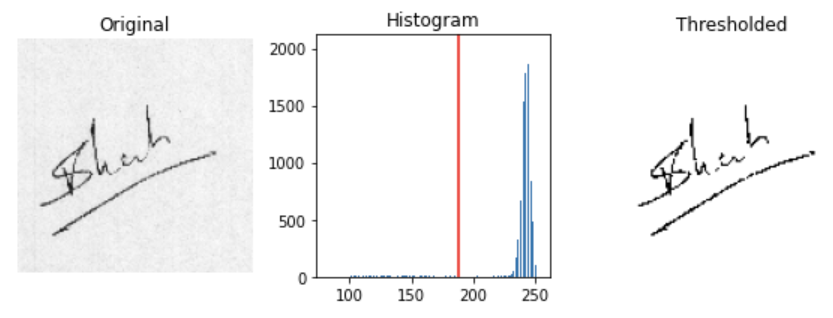
Figure 4. Sample signature image before (left) and after (right) applying Otsu’s method to threshold pixel values. The histogram (middle) depicts the distribution of grayscale intensity values where the red vertical depicts the optimal threshold for separating classes.
Otsu’s Method assumes a bimodal distribution of pixel intensities, and determines the optimal threshold by maximizing the variance between two classes on the histogram. In the figure above, we see an unbalanced, bimodal distribution for the original signature with peaks at intensity values of ~140 and ~245. When applying the optimal threshold of 188 to separate the two peaks, we are left with a cleanly extracted signature.
We can then apply this signature extraction technique to all examples in the CEDAR dataset, yielding a clean set of signatures where both classes come from roughly the same pixel intensity distribution.
![]()
Figure 5. Mean pixel intensity of thresholded, grayscale CEDAR signatures separated by genuine and forged classes after thresholding
Representation Extraction with Pretrained CNNs
With the cleaned-up dataset, we are now ready to implement our classification baseline. If you recall from Figure 1, the baseline approach relies on a pretrained network to extract features from the grayscale signatures. For our initial experimentation, we will make use of a ResNet50 architecture that has been pretrained on ImageNet. Specifically, we will pass each image through ResNet and extract features from the final layer of the backbone network (fully connected layers omitted), producing feature vectors of size 32,768 for each image.
This approach relies on the assumption that the convolutional filters learned by layers in ResNet (trained on ImageNet) will produce activation maps that capture enough variance to effectively discriminate between genuine and forged examples. As such, we can make a cursory attempt to validate our assumption by reducing embeddings to two dimensions via UMAP and plotting the resulting vectors for visual inspection.
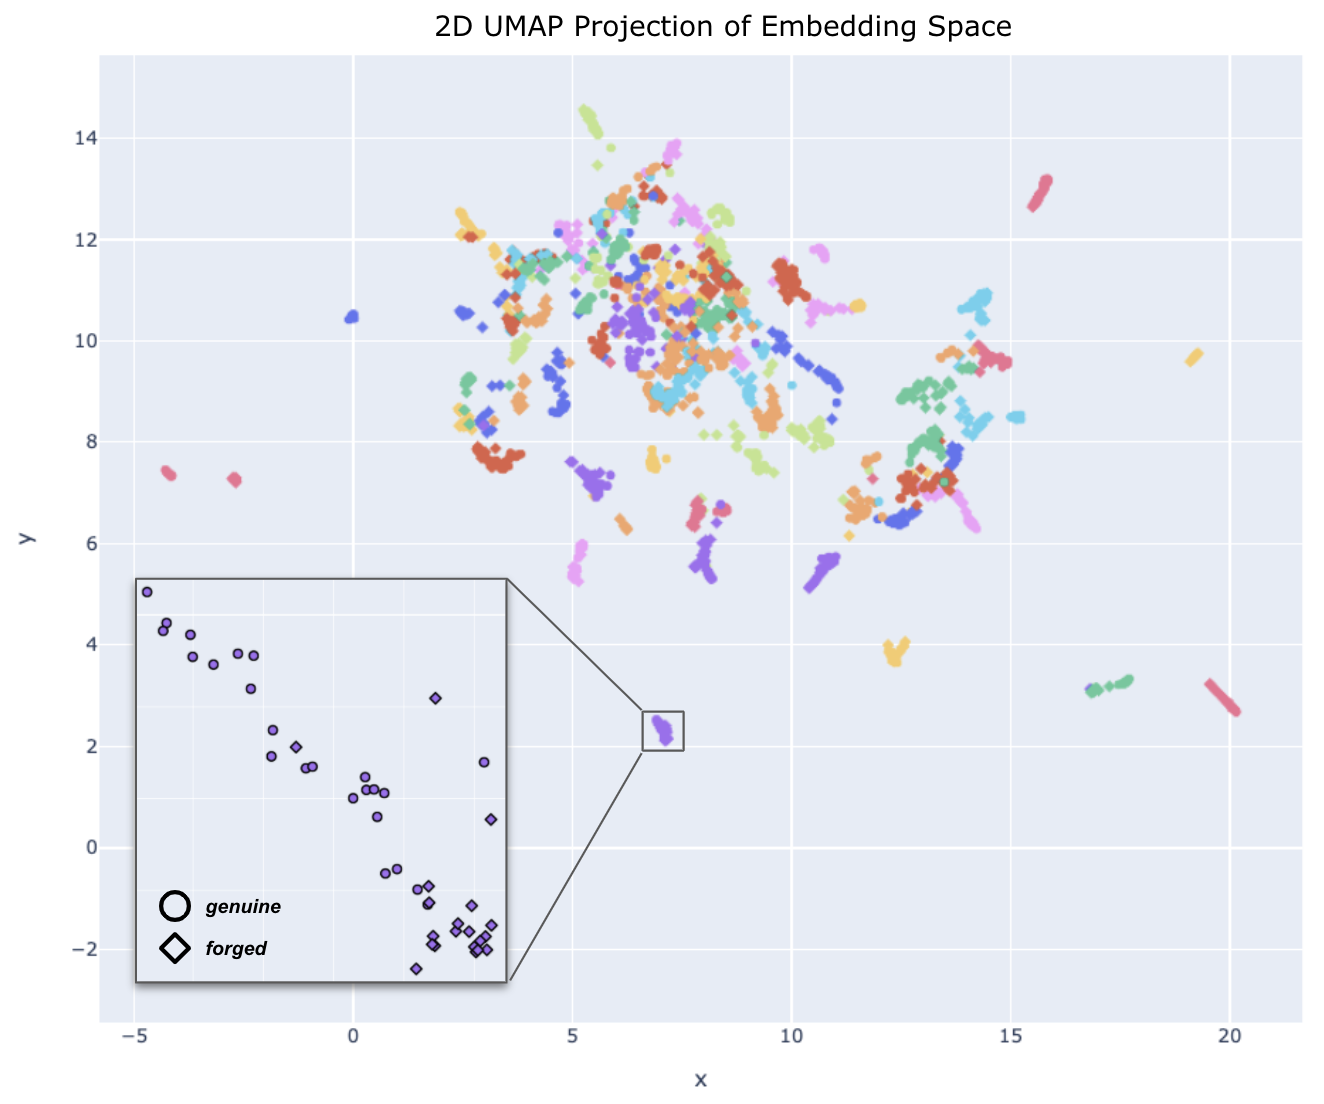
Figure 6. A 2D UMAP projection of the embedding space for each signature in the CEDAR dataset colored by author
Despite the overlap of differing author groups (which is expected when reducing dimensionality while trying to maintain variance), we do observe coherent clusters for many of the authors’ signatures. Additionally, we also see that within a given author cluster, the pretrained model is able to maintain separation between genuine and forged classes as seen in the bottom left zoomed area (circles vs. diamonds). The qualitative results shown here provide preliminary confidence in the validity of our baseline approach; now let’s extend this approach to quantify system performance.
Developing a Classification Baseline with a Distance Metric
We now have a meaningful vector representation for each image, which can be used to compare two signatures by calculating a distance metric between them. This distance metric can then be used to classify the image pair as genuine or forged. But first, we need an experimental setup consisting of image pairs split between classes. For each author, we collect the following classes of image pairs:
- genuine - genuine: two signatures signed by the same author at different times
- genuine - forged: a signature and an intentionally forged attempt of that same signature
- genuine - unskilled forged: a signature and another signature of a different/random author
To maintain a balanced number of image pairs for each class, we will utilize all 276 genuine/genuine pairs for each author (C(24,2) = 276), and randomly downsample the other classes to have the same number of examples. Next, we set aside 20% (or 11) authors as a validation set and utilize the other 44 authors’ samples as a train set to determine a classification distance threshold (more on this in a bit).
Until now, we’ve discussed the idea of calculating a distance metric between vector representations of images, but what distance metric do we use?
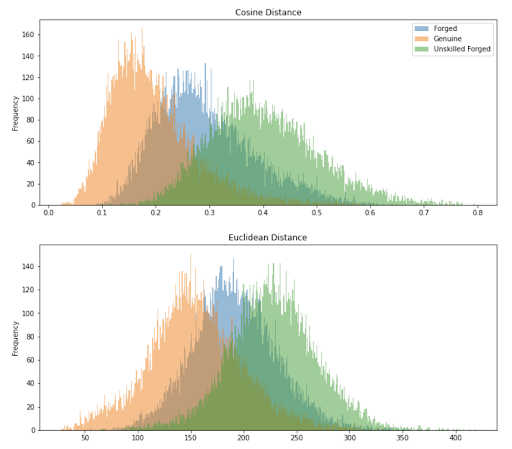
Figure 7. Distribution of distance metric (cosine and euclidean) for each image pair in the experimental setup, colored by class
The figure above plots a histogram of image pairs colored by class for two distance metrics: cosine and euclidean. Both plots confirm our intuition that on average, genuine-genuine pairs should have the lowest semantic distance between them; followed by genuine-forged, and finally genuine-unskilled forged. In addition, we see that the cosine distance metric does a better job at separating the classes than euclidean distance. For this reason, we will utilize cosine distance as our metric for the remainder of the analysis. We will also drop the unskilled forged class from consideration, and focus on binary classification between genuine and forged signatures.
Determining an Optimal Distance Threshold
Now that we’ve developed the basis of our approach, we are left with an important question: “What distance threshold should be selected to classify signature pairs as genuine or forged?” As with any classification task, tuning this hyperparameter is problem-dependent and will ultimately depend on the relative cost tradeoff between false positives and false negatives. For biometric systems, this tradeoff attempts to balance:
- False Acceptance Rate (FAR) - accepting signers who should have actually been rejected, with
- False Rejection Rate (FRR) - rejecting legitimate signers when they should have been accepted.
In the domain of security and verification, FAR (unauthorized access) is typically worse than FRR (authorized user denied) as the former could be a security disaster, while the latter an inconvenience. 4
Defining Evaluation Metrics for Signature Verification - Equal Error Rate
In an effort to sidestep the subjective, application-dependent balancing act between convenience and security, we will turn to an objective measure of system performance that is commonly used when comparing security system capacity called Equal Error Rate (EER).
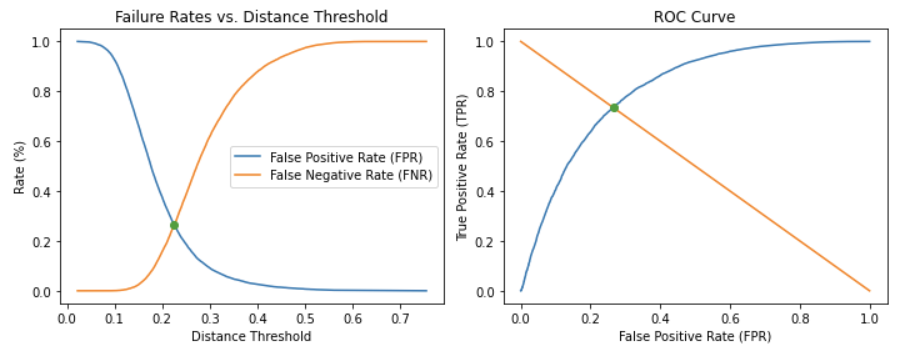
Figure 8. EER shown as intersection of FPR and FNR curves (left). EER as intersection of ROC curve with inverse diagonal slope (right).
EER, also known as Crossover Error Rate (CER), corresponds to the threshold at which the FAR is equal to FRR. This point also occurs at the intersection of the receiver operating characteristic (ROC) curve and the negative diagonal unit slope. Practically speaking, this isn’t a metric you would likely calibrate a system for - but, as mentioned above, it provides a comparable, objective measure of performance. On our train set with features extracted from the final layer of ResNet50, we observe an EER of 26.5% at a distance threshold of 0.23. Considering there has been no model training, this result isn’t too bad, but is there room for improvement?
Selecting the Best Model
Up until this point, we’ve only considered the final layer of a ResNet50 model as our feature extractor. But how might other pretrained models perform? And could earlier layers of a CNN that learn simple, low-level features outperform the more generalized, semantic features of the final layers? To find out, we repeat the above experiment across early, middle, and final layer blocks from ResNet50, VGG16, MobileNet_v2, and EfficientNetB0.
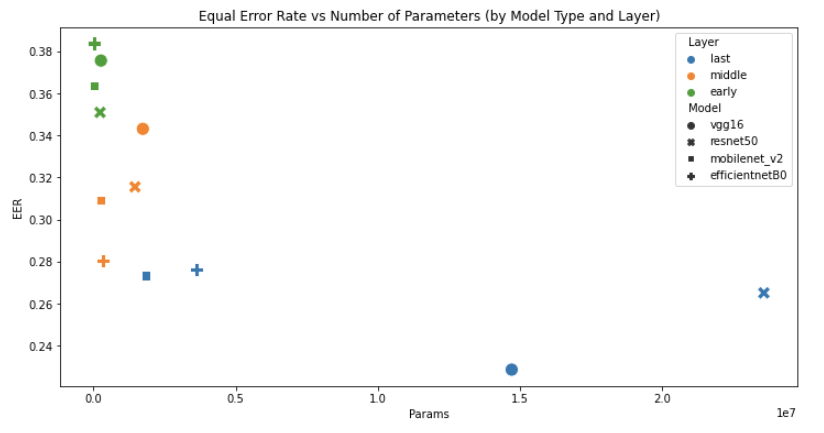
Figure 9. Comparison of model and layer combinations by number of parameters and EER
By plotting model and layer combinations against EER and number of parameters, we immediately notice an inverse relationship between number of parameters and error. This makes sense as the number of parameters implies capacity for learning. However, despite having only the second-most parameters, the final layer of VGG16 (blue circle) outperforms the larger, final layer ResNet50 model (blue X) with an EER of 22.8% at a distance threshold of 0.32.
By taking the strongest performing VGG16 model, applying the 0.32 threshold, and classifying the remaining examples from the held out test dataset, we achieve an overall accuracy of 67.0%, a false acceptance rate of 8.2%, and a false rejection rate of 39.1%. Not bad!
Conclusion
In this post, we developed a baseline classification approach to the task of offline signature verification using extracted representations from several pretrained CNN architectures. In doing so, we gained insight around our motivating questions:
- Are pretrained models a plausible baseline for the task of signature verification? Yes! By applying this technique to the CEDAR dataset, we obtained a model that can correctly discriminate between genuine and forged signature pairs with an accuracy of 67% without any training.
- Do early network layers extract more meaningful features in the context of signatures? Surprisingly, no. Despite the fact that early layers do learn more simplistic, lower-level features, we found that later layers consistently provide more meaningful feature sets for our task.
- Does model size equate to higher performance? Generally, yes. While we have found an inverse relationship between model size and error rate, there is a diminishing return in performance as model size increases. For example, ResNet50’s error improves by just ~4%, despite having a 16x increase in capacity between the middle and final layer blocks.
In the next post, we’ll look to improve upon this established baseline through the use of metric learning. Stay tuned!
References
-
Dey, Sounak, et al. “Signet: Convolutional siamese network for writer independent offline signature verification.” arXiv preprint arXiv:1707.02131 (2017). https://arxiv.org/pdf/1707.02131.pdf ↩︎
-
Hafemann, Luiz G., Robert Sabourin, and Luiz S. Oliveira. “Offline handwritten signature verification—literature review.” 2017 Seventh International Conference on Image Processing Theory, Tools and Applications (IPTA). IEEE, 2017. https://arxiv.org/pdf/1507.07909.pdf ↩︎
-
Thresholding https://scikit-image.org/docs/0.13.x/auto_examples/xx_applications/plot_thresholding.html ↩︎
-
Biometric security and hypothesis testing https://www.johndcook.com/blog/2018/10/31/biometric-security-error/ ↩︎